|
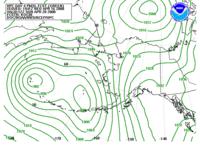
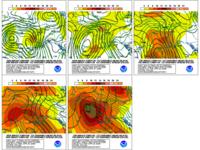
Alaskan Day 4-8 Sea Level Pressure Forecasts
WPC, GFS, and GFS Ensemble Guidance
Note:
These products are currently experimental and may not update regularly.
The images below represent sea level pressure forecasts utilizing the latest operational models and/or
ensemble guidance.
|
WPC Forecast
|
WPC vs GFS
|
WPC vs Ensemble Mean
& Spread
|
To view individual forecast days and day 4-8 loops, please click on the appropriate link below.
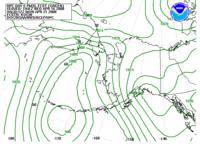
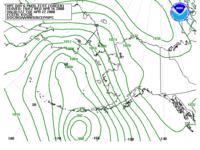
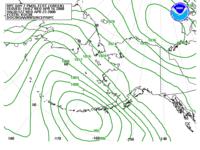
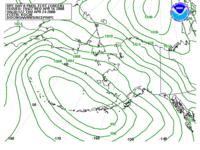
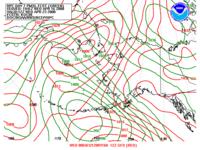
The following images represent WPC's forecast.
Day 4
|
Day 5
|
Day 6
|
Day 7
|
Day 8
|
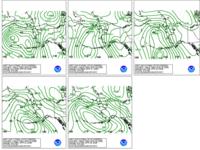
Days 4 to 8
|
 Loop of WPC's forecasts from days 4-8.
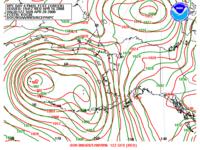
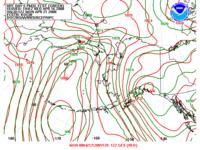
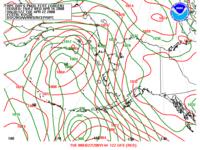
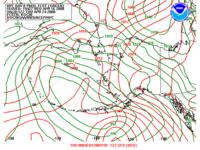
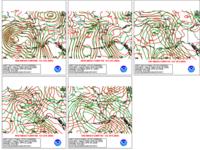
Comparison between the 00Z or 12Z GFS
(in red) and WPC's forecast.
Day 4
|
Day 5
|
Day 6
|
Day 7
|
Day 8
|
Days 4 to 8
|
Loop of WPC's forecast versus the 00Z or 12Z GFS from days 4-8.
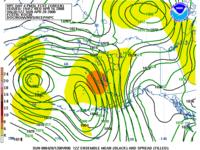
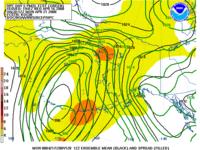
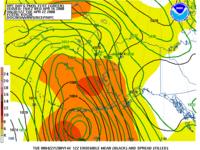
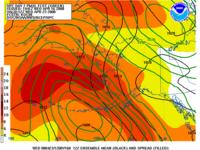
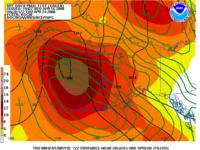
Comparison between the 00Z or 12Z GFS Ensemble Mean (in black) and WPC's forecast. The shaded regions represent
the spread (in millibars) of the ensemble forecasts.
Day 4
|
Day 5
|
Day 6
|
Day 7
|
Day 8
|
Days 4 to 8
|
Loop of WPC forecast/Ensemble Mean and
Spread for days 4-8.
|