|
December 1955 Flood |
|
Like most of the heavy rainfall events in California, this event was a multi-day event and ranked second on the list. The heaviest 3-day period was from 1200 UTC 21 December-1200 UTC 24 December. However, heavy rainfall occurred on the 20th over northern California with 15.33 inches reported in Shasta County. Near record flows were reported for central valley California Rivers. The flooding resulted on a dam-break on the Feather river near Yuba City which flooded 100,000 acres. Flooding killed 74, 34 of which died along the Feather River (Roos, 2007, Null website). Intense flooding also occurred along the Carson River Basin in Nevada with the flooding comparable to that of the 1997 flood. This event also produced major flooding in Oregon. |
|
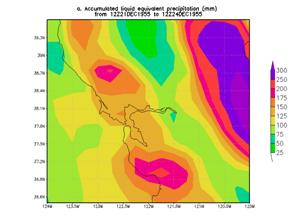
Heaviest 3-day rainfall analysis using the CDC .25 deg by .25 deg unified data set ending 1200 UCT 24 Dec 1955. |
|
One thing to note is how similar the Dec. 1955 pattern is to the 1964 extreme event pattern (compare 500-hPa anomaly pattern below with the one here). At 500-hPa, both have anomalous high heights in the vicinity of Alaska and the Bering Strait and the positive tilting negative anomaly to its south and east. This negative coupled with a second positive height anomaly to its south ensures a long westerly to west-southwesterly fetch. Also, like the 1964 event, this event was associated with a strong atmospheric river that contained anomalously high PWS and moisture flux. |
|
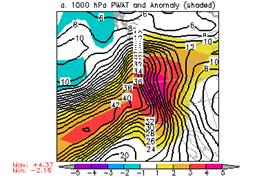
PW (mm) and normalized PW anomaly (magnitude of the anomaly scale is shown on the scale at the bottom of the figure) valid 0000 UTC 22 December 1955 (top) and 1200 UTC 22 December 1955 (bottom). |
|
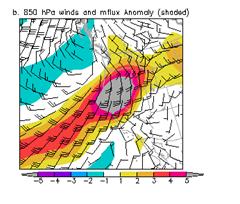
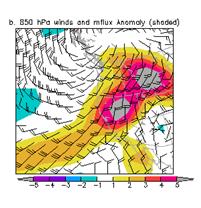
850-hPa winds and normalized moisture flux anomaly at 0000 UTC 22 December 1955 (top) and 1200 UTC 22 December 1955 (bottom). (magnitude of the anomaly scale is shown on the scale at the bottom of the figure) |
|
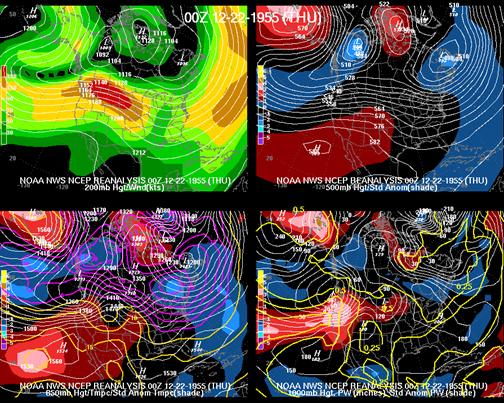
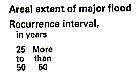
Large area 4-panel chart, 200-hPa heights and isotachs (top left), 500-hPa heights and normalized height anomaly (top right), 850-hPa heights and normalized temperature anomaly (bottom left), and 1000-hPa height and normalized PW anomaly (bottom right) valid 0000 UTC 22 Dec 1955. The magnitude of the normalized anomalies are given by the color fill with the scale on the left had side of each panel. |
|
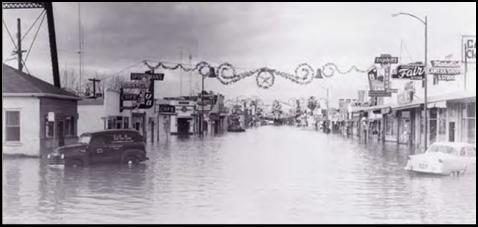
Picture of the 1955 flood from Roos (2007) |
|
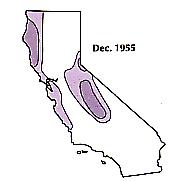
The map above right is based on (Paulson et al, U.S. Geological Survey Water-Supply Paper 2375, 591 ) and shows the areas in California were flooding was located along with an estimate of the recurrence interval of a flood of that magnitude. |
|
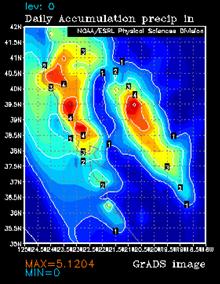
Precipitation analysis of the 24 hours (in inches) ending at 1200 UTC 22 Dec 1955 from the .25 by 2.5 deg. unified data set. |
|
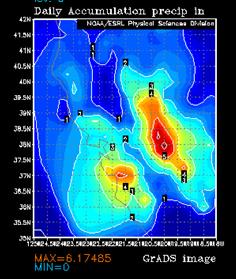
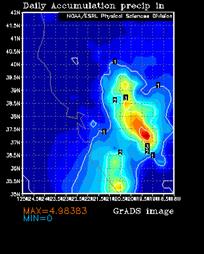
Precipitation analysis of the 24 hours (in inches) ending at 1200 UTC 23 Dec 1955 from the .25 by 2.5 deg. unified data set. |
|
Precipitation analysis of the 24 hours (in inches) ending at 1200 UTC 23 Dec 1955 from the .25 by 2.5 deg. unified data set. |
|
During the single heaviest day of rainfall over central California, the normalized PW anomaly exceeded 4 standard deviations (see below) and the normalized 850-hPa moisture flux anomaly exceeded 5. The pattern of anomalies was signaling a major rainfall event. The magnitude of the PW anomaly suggests a return frequency of at least 24 months. Since the major rainfall events all occurred during the 6-month cool season, the 24 months probably translates to about a 4-year return frequency. Both axis of high moisture flux and PW remains over the same area for an extended period which raised the systems rainfall potential and probably made it even more anomalous than the implied by simply looking return period on the return period figures shown here. |