|
January 1974 event |
|
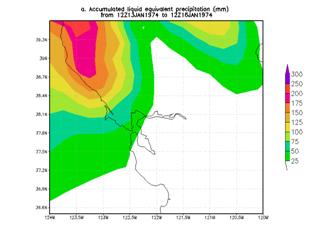
This event ranked highly but its effects were well north of San Francisco. The event produce significant flooding on the Klamath and Noya rivers along California’s North Coast. The Noya river streamflow records provide some perspective on the magnitude of the flooding of the rivers along the North Coast. 50% or the time the Noya stream flow is less than 32 cfs but during the flood reached a record crest of 26600 cfs. Major flooding in Oregon, Idaho and Montana were also associated with the event. |
|
Heaviest 3-day rainfall analysis using the CDC .25 deg by .25 deg unified data set ending 1200 UCT 16 Jan 1974. |
|
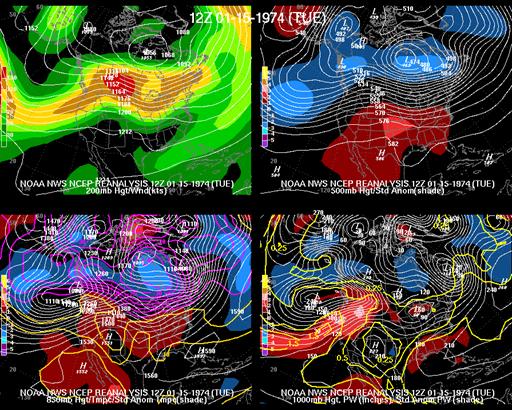
Large area 4-panel chart, 200-hPa heights and isotachs (top left), 500-hPa heights and normalized height anomaly (top right), 850-hPa heights and normalized temperature anomaly (bottom left), and 1000-hPa height and normalized PW anomaly (bottom right) valid 1200 UTC 15 Jan. 1974. The magnitude of the normalized anomalies are given by the color fill with the scale on the left had side of each panel. |
|
The synoptic pattern in most respects is similar to the other events. At 500-hPa, a positive height anomaly is again found in the vicinity of the Bering Sea and negative height anomaly is located to its south (see below). The second more southerly negative height anomaly is a little east and south of many of the other cases. The increase ridging to the east probably helped direct the moisture plume more into California’s North Coast and into Oregon than some of the other events. Like many “pineapple connection” or atmospheric river events, abnormally warm temperature and high snow levels were present so for locations in the Cascade range and northern Rocky Mountains, snow melt and heavy rain contributed to the flooding. The entrance region of any upper level jet streak was also present along the North Coast. |
|
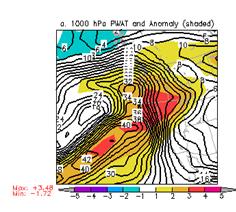
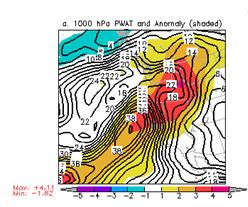
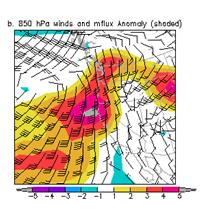
Like during many of the other events, a strong atmospheric river with anomalously high PW and 850-hPa moisture flux was impinging upon the coast during the period of heavy rainfall (see figures below). In this case, the highly anomalous moisture extended northeast across Oregon into Idaho and Montana with the PW anomaly reaching 4 sigma over Idaho and the moisture flux anomaly exceeding 5 sigma. Granted over the Rocky Mountains a forecaster should look at moisture flux anomalies at a higher level than 850-hPa, Still, the analyses suggest the amount or moisture moisture flux during this event were highly unusual. |
|
PW (mm) and normalized PW anomaly (magnitude of the anomaly scale is shown on the scale at the bottom of the figure) valid 0600 UTC 15 Jan. 1974 (top panel), 1200 UTC 15 Jan. 1974 (bottom panel). |
|
850-hPa winds (standard barbs and flags) and normalized anomaly of 850-hPa moisture flux (magnitude is given by the color fill from the bar at the bottom of the figure) valid 0600 UTC 15 Jan. 1974 (top panel), 1200 UTC 15 Jan. 1974 (bottom panel). |

|
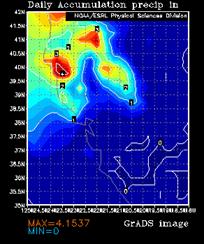
Precipitation analysis of the 24 hours (in inches) ending at 1200 UTC 15 Jan 1974 from the .25 by 2.5 deg. unified data set. |
|
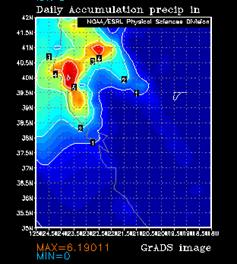
Precipitation analysis of the 24 hours (in inches) ending at 1200 UTC 16 Jan 1974 from the .25 by 2.5 deg. unified data set. |