|
1200 UTC 09 –12 Nov 1973 rainfall event |
|
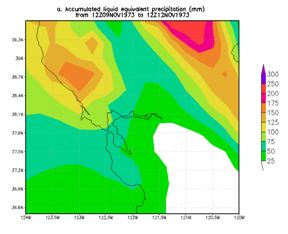
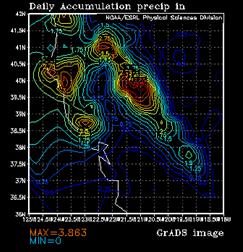
No reports of serious flooding could be found from this 3-day rainfall event despite its ranking in the top 20 events within the data set. The 72-hr QPE from the CDC .25 by .25 deg. unified data set (below left) ending 1200 UTC 12 Nov. 2973 and the analysis for the heaviest 24-hr period (below right) offer a general feel for the precipitation pattern but likely underdo the magnitude of the heaviest rainfall by quite a bit. |
|
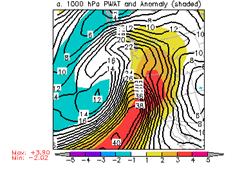
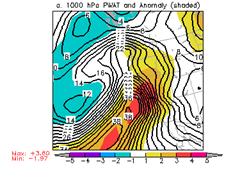
PW (mm) and normalized PW anomaly (magnitude of the anomaly scale is shown on the scale at the bottom of the figure) valid 0000 UTC 11 Nov. 1973 (top panel), 0600 UTC 11 Nov. 1973 (bottom panel). |
|
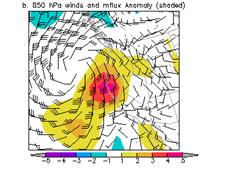
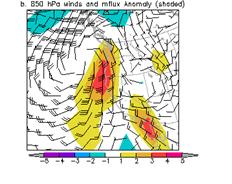
850-hPa winds (standard barbs and flags) and normalized anomaly of 850-hPa moisture flux (magnitude is given by the color fill from the bar at the bottom of the figure) valid 0000 UTC 11 Nov. 1973 (top panel), 0600 UTC 11 Nov. 1973 (bottom panel). |
|
Heaviest 3-day rainfall analysis using the CDC .25 deg by .25 deg unified data set ending 1200 UCT 12 Nov. 1973. |
|
24-hr rainfall analysis using the CDC .25 deg by .25 deg unified data set ending 1200 UCT 11 Nov. 1973 for the heaviest of the 3 days.(in inches) |
|
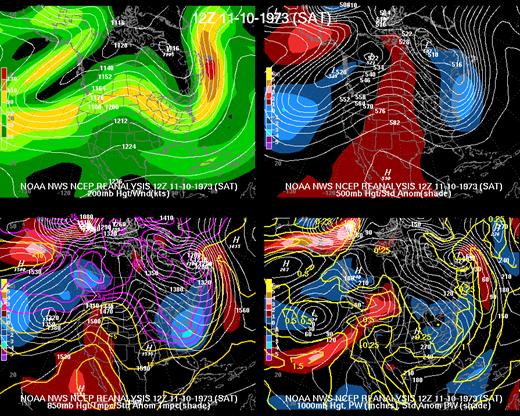
The synoptic pattern was very similar to the pattern associated with the majority of the 20 events. An area of anomalously high heights was located over much of Alaska including a maximum over the Aleutian Islands. A strong negative anomaly was located to its southeast with still another positive to its east-southeast and east. A strong low was indicated by the 850-hPa height analysis and was located off the coast of California and Oregon. This low and the ridging to the southeast helped provide southwesterly flow that tapped into a strong atmospheric river that intersected the coast (see below) |
|
Large area 4-panel chart, 200-hPa heights and isotachs (top left), 500-hPa heights and normalized height anomaly (top right), 850-hPa heights and normalized temperature anomaly (bottom left), and 1000-hPa height and normalized PW anomaly (bottom right) valid 1200 UTC 10 Nov 1973. The magnitude of the normalized anomalies are given by the color fill with the scale on the left had side of each panel. |
|
The normalized anomaly PW and 850 moisture flux plots below indicate that within the atmospheric river the PW anomaly exceeded 3 sigma and the normalized 850 MF anomaly briefly reached 4 sigma. They suggest a return frequency for having an atmospheric river of similar magnitude over that location is about once every one or two seasons. |