|
The 3-day period in 1960 was the 15 highest ranked event. No reports of serious flooding could be found from this 3-day rainfall event despite its ranking in the top 20 events within the data set. This suggests that antecedent conditions are an important player in determining whether major flooding will occur. |
|
1200Z 6 Feb 1960-1200 UTC 9 Feb 1960 |
|
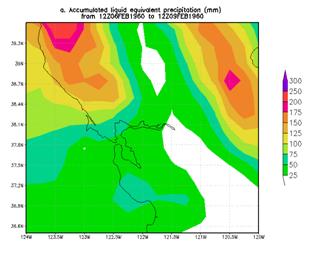
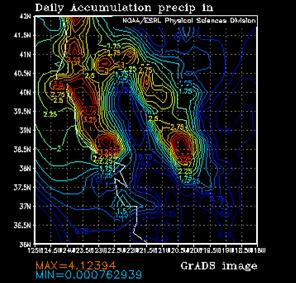
24-hr rainfall analysis using the CDC .25 deg by .25 deg unified data set ending 1200 UCT 08 Feb. 1960 for the heaviest of the 3 days. |
|
Heaviest 3-day rainfall analysis using the CDC .25 deg by .25 deg unified data set ending 1200 UCT 09 Feb. 1960. |
|
The heavy precipitation associated with this 3-day event generally occurred north of San Francisco. Again it is worth noting that the actual precipitation was probably quite a bit heaviest than the amounts analyzed using the rather course resolution CDC data set.
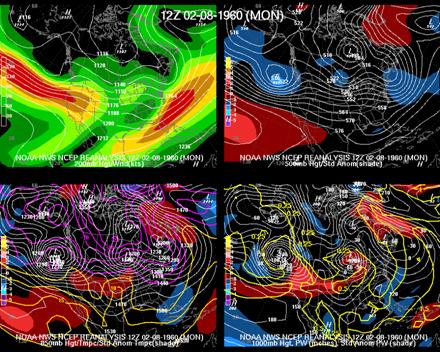
The region where the strongest geopotential height gradient was located and where the atmospheric river impinged upon California north of SFO which probably explains why the heaviest precipitation was also positioned north of the city. The synoptic pattern associated with this event had a strong negative height anomaly off the pacific northwest coast with a positive anomaly to its south and southwest at 500-hPa and 700-hpa (not shown). This couplet and the resulting gradient helped produce a long fetch of strong westerly flow. The strong shortwave associated with the negative height anomalies resulted in a strong cyclone which was evident on the 1000-hPa and 850-hPa analyses (see below) |
|
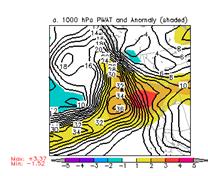
PW (mm) and normalized PW anomaly (magnitude of the anomaly scale is shown on the scale at the bottom of the figure) valid 0600 UTC 08 Feb. 1960 (top panel), 1200 UTC 08 Feb. 1960 (bottom panel). |
|
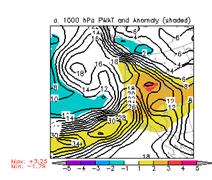
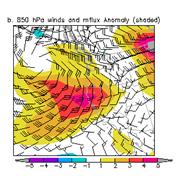
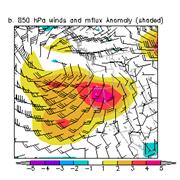
850-hPa winds (standard barbs and flags) and normalized anomaly of 850-hPa moisture flux (magnitude is given by the color fill from the bar at the bottom of the figure) valid 0600 UTC 08 Feb. 1960 (top panel), 1200 UTC 08 Feb. 1960 (bottom panel. |
|
Large area 4-panel chart, 200-hPa heights and isotachs (top left), 500-hPa heights and normalized height anomaly (top right), 850-hPa heights and normalized temperature anomaly (bottom left), and 1000-hPa height and normalized PW anomaly (bottom right) valid 1200 UTC 08 Feb 1960. The magnitude of the normalized anomalies are given by the color fill with the scale on the left had side of each panel. |
|
The PW values within the plume were high enough to classify the atmospheric river a strong one. However, the normalized PW anomaly only reach a little over 3 which puts the return period at around 3 months meaning during any season, a forecaster might see two such plumes intersecting the same region of the coast. The strong 850-hPa winds helped produce a normalized 850 MF of greater than 4 sigma. This suggests for a similar normalized MF anomaly, the return period of having that strong of MF would be around 6 months, or about once during the rainy season. |