
|
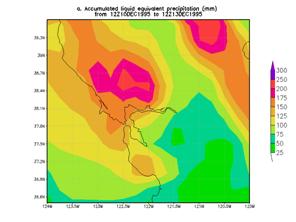
1200 UTC 10 Dec through 1200 UTC 13 Dec. 1995 event. |
|
The 3-days period ranked 18th on the list. The weather prior to the event had been dry which minimized the run off problems (Reynolds 1996). As noted by Reynolds, synoptically the pattern was very similar to the pattern that was present during the January and March 1995 events. A strong shortwave at 500-hPa that had anomalously low heights associated with it was off the coast of northern California. A potent low pressure system had developed in response to this feature. This strong low and a ridge to its southeast provided a strong height and pressure gradient implying strong southwesterly low level winds. These southwesterly winds helped initiate the northward movement of a strong atmospheric river that impinged the coast (see below). |
|
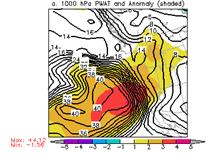
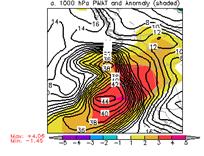
PW (mm) and normalized PW anomaly (magnitude of the anomaly scale is shown on the scale at the bottom of the figure) valid 0000 UTC 12 Dec. 1995 (top panel), 0600 UTC 12 Dec. 1995 (bottom panel). |
|
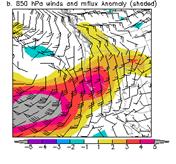
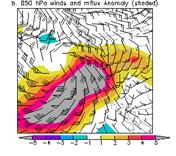
850-hPa winds (standard barbs and flags) and normalized anomaly of 850-hPa moisture flux (magnitude is given by the color fill from the bar at the bottom of the figure) valid 0000 UTC 12 Dec. 1995 (top panel), 0600 UTC 12 Dec. 1995 (bottom panel). |
|
Large area 4-panel chart, 200-hPa heights and isotachs (top left), 500-hPa heights and normalized height anomaly (top right), 850-hPa heights and normalized temperature anomaly (bottom left), and 1000-hPa height and normalized PW anomaly (bottom right) valid 0000 UTC 12 Dec. 1995. The magnitude of the normalized anomalies are given by the color fill with the scale on the left had side of each panel. |
|
Like many atmospheric river or pineapple express cases, this event was associated with above normal 850-hPa temperatures that were drawn northward by the strong low level winds and an anomalously strong v-wind component (not shown). The normalized MF and PW anomalies were impressive and were on the same order as many of the other significant events. The magnitude of the normalized MF anomaly suggests that this event was associated with a rather rare atmospheric river despite the lack of major flooding. |
|
Heaviest 3-day rainfall analysis using the CDC .25 deg by .25 deg unified data set ending 1200 UCT 10 Dec 1995-1200 UTC 13 Dec 1995. |
|
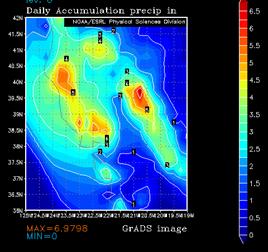
The 24 hr period of heaviest rain during the 3 day period. 24-hr CDC QPE ending 1200 UTC 12 Dec. 1995. |
|
That the CDC 24-h analysis showed a maximum of almost 7.00 inches attests to this being a significant rainfall event as it usually underdoes the maximum. The 24 hour HPC analysis (not shown) for the same period indicated over 5 inches of rainfall just north of San Francisco Bay and another over the Siskiyou Mountains of northern California in the vicinity of the two ovals depicted on the map (top right). |