|
December 1999 was the third driest December on record to south central California which probably accounts for the lack of major flooding. However, the Maraposa County Sherriff reported that street flooding had occurred in the San Joaquin Valley and that numerous roads were closed due to creeks flooding roads in the county according to NOAA Weather Service Storm Data |
|
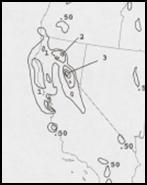
24 hr HPC QPE analysis (in inches) ending at 1200 UTC 12 Feb 2000. |
|
24 hr HPC QPE analysis (in inches) ending at 1200 UTC 13 Feb 2000. |
|
4 |
|
24 hr HPC QPE analysis (in inches) ending at 1200 UTC 14 Feb 2000. |
|
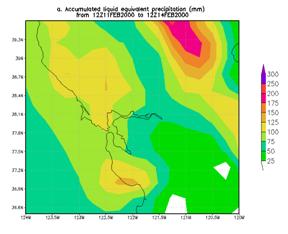
Heaviest 3-day precipitation analysis using the CDC .25 deg by .25 deg unified data set ending 1200 UCT 14 Feb 2000 (in mm). |
|
While the precipitation analyses shown below indicate a very wet three day period. A 10-year study by Junker et al. (in press) suggests that the 24 hour maximum observed on the map ending at 1200 UTC 14 Feb. was exceeded a number of times. That the event made the top 20 3-day total raises the question of whether the list is biased towards recent events because precipitation observational data has increased during the last several decades. |
|
1200 UTC 11 Feb. to 1200 UTC 14 Feb 2000 event |
|
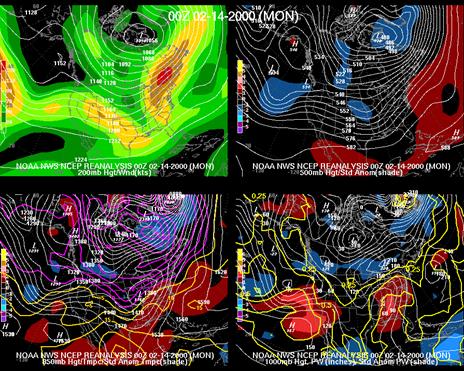
The synoptic pattern was a variation on the common pattern associated with most of the ranked cases. A positive (albeit a weak one) and closed 500-hPa high were located in the vicinity of Alaska. There is also a negative to the south of this positive height anomaly (see figure below). However, the magnitude of both the positive and negative anomalies were weaker than during most of other 19 cases. Like with most cases, there was also a second positive height anomaly to the southeast of the negative one. |