|
12Z27MAR1974 12Z30MAR1974 |
|
While the most significant flooding during 1974 was during the January storm. An Army Corps of Engineer report was written that included flooding in March along the Russian River in northern California. The rainfall during the 12Z 27 March to 1200Z March 1974 made the list of the top 20 but barely and would not have made the list if 3 day periods like Dec 21-24 1964 or Feb 16-19 1986 had been included. They were not included as one or more of their 24 hour periods were already included in the 72 hour period listed for the event. |
|
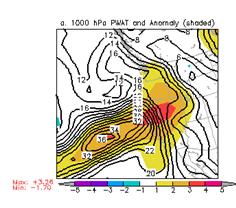
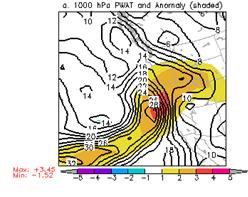
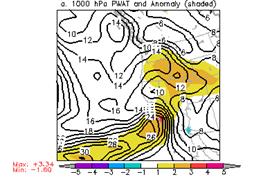
PW (mm) and normalized PW anomaly (magnitude of the anomaly scale is shown on the scale at the bottom of the figure) valid 1800 UTC 29 Mar. 1974 (top panel), 0600 UTC 30 Feb. 1974 (middle panel) and 1200 UTC 30 Feb 1974 (bottom panel). |
|
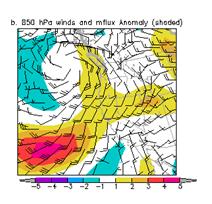
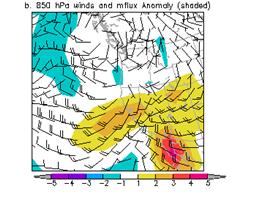
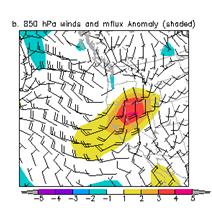
850-hPa winds (standard barbs and flags) and normalized anomaly of 850-hPa moisture flux (magnitude is given by the color fill from the bar at the bottom of the figure) valid 1800 UTC 29 Mar. 1974 (top panel), 0600 UTC 30 Feb. 1974 (middle panel) and 1200 UTC 30 Feb 1974 (bottom panel). |
|
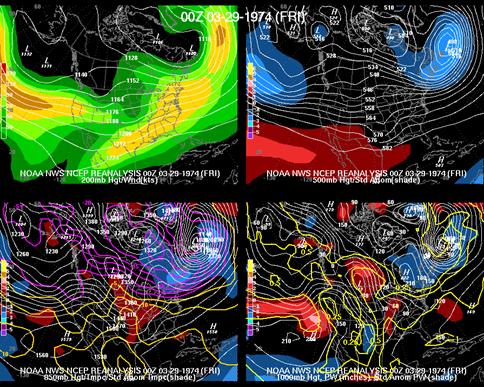
Large area 4-panel chart, 200-hPa heights and isotachs (top left), 500-hPa heights and normalized height anomaly (top right), 850-hPa heights and normalized temperature anomaly (bottom left), and 1000-hPa height and normalized PW anomaly (bottom right) valid 0000 UTC 29 Mar. 1974. The magnitude of the normalized anomalies are given by the color fill with the scale on the left had side of each panel. |
|
The case is unusually in that there was no area of anomalously high 500-hPa heights across Canada, Alaska or the Bering Straits (see below) . Also, the strong negative height anomaly off the west coast of the U.S was a little farther west than during most of the other cases. However, there was a greater than 2s positive height departure from normal south of the negative which helped produce a stronger than normal geopotential height gradient. |

|
24-hr rainfall analysis using the CDC .25 deg by .25 deg unified data set ending 1200 UCT 29 Mar 1974 (inches) |
|
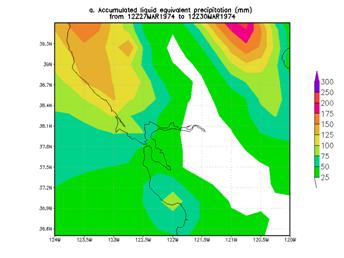
Heaviest 3-day rainfall analysis using the CDC .25 deg by .25 deg unified data set ending 1200 UCT 30 Mar 1997 (in mm). |
|
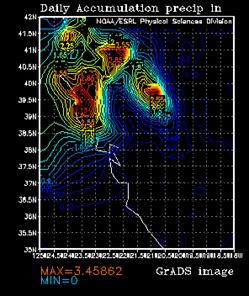
24-hr rainfall analysis using the CDC .25 deg by .25 deg unified data set ending 1200 UCT 30 Mar 1974 (inches) |
|
The heaviest rainfall occurred north of San Francisco where a strong atmospheric river impinged upon the area during March 29 and 30. |
|
Again, the precipitable water within the atmospheric river was high enough to meet Neiman et al. (2008) criteria for a strong atmospheric river (see the images below). A normalized 850 MF anomaly of greater than 4 was located off the California coast at 1800 UCT 29 March. This moisture plume swung into the coast and brought a greater than 3 sigma PW anomaly into northern California by 0000 UCT Mar 30 and a greater than 3 normalized 850 MF anomaly into the Sierra Nevada by 0600 UTC 30 March (see figures below). The return period for such normalized anomalies is about 3 months suggesting that an atmospheric river of similar strength will impact the coast about twice during a rainy season |