|
Latent heat and the generation of mesoscale convective vortices |
|
The effect of latent heat on the general circulation pattern is to superimpose an anticyclonic perturbation at the upper-levels and a cyclone at the low and mid-levels just above a shallow layer of cool air near the surface (Kreitzberg, C.W and D.J. Perkey, 1977, Maddox and Fritsch, 1980, Fritsch and Maddox 1981 Perkey and Fritch 1981). Maddox (1980) found that the convection associated with quasi-circular systems usually started to form during the afternoon but that the convection usually did not organize into a system until early evening. He noted that most of these systems grew to maximum size on the satellite imagery after midnight and persistent into the morning hours.
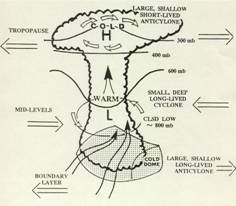
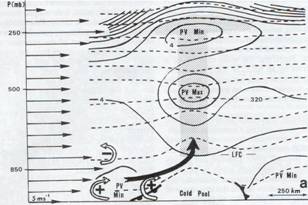
The effects of latent heat can play an important role in the development and enhancement of mesoscale circulations (Keyser and Johnson, 1984). The development of a cyclonic low-level circulation acts to enhance the low-level southerly jet on the east side of the convective system. This leads to an increase in the amount of moisture feeding into the complex. The release of latent heat also helps to superimpose an upper level anticyclone over the convection. The following two figures give a general idea of the affects of latent heat and the typical mesoscale circulation that often develops. The impact of convection it to develop and anticyclone at upper-levels and generate cyclonic vorticity in the mid-levels. |
|
From Frisch et al, 1994 |
|
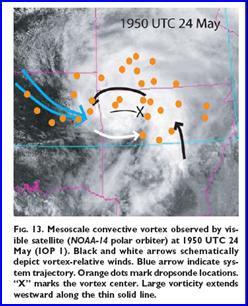
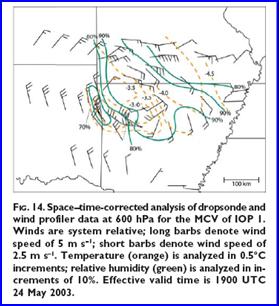
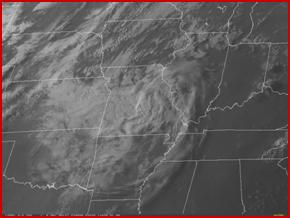
The cyclonic low and mid-level circulation that develops with a strong convective complex sometimes shows up on the satellite imagery once the parent convective complex dissipates. Typically, these convectively induced mesoscale cyclonic vortices (MCV) show up first on the visible imagery. Cumulus and towering clouds usually define the circulation center once diurnal heating gets underway. A banded structure usually becomes defined between 1800 and 2100 UTC, during the time of maximum heating (Bartels and Maddox, 1989). The figure below left shows a typical looking MCV on the visible imagery and the figure on the left shows the system relative winds at 600-hPa. |
|
From Bartels and Maddox 1991 |
|
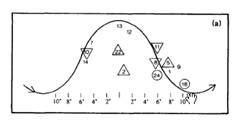
MCVs tend to from in regions of weak shear and light mid and upper level winds. The figure below shows the location of MCVs with respect to the synoptic scale mid-level ridge. Note that number of the cases occur either downstream from the ridge or to its south. Bartels and Maddox found that 10 of the 24 meso-vortices that they studies were associated with subsequent MSCs or a series of MCSs. Therefore, such vortices need to be monitored closely. |
|
From Davis et al. 2004 |
|
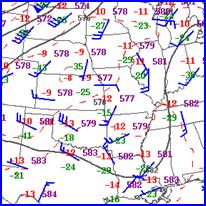
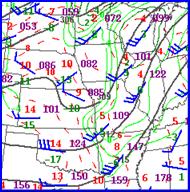
500-hPa analysis valid 12 UTC 6 May 2000 |
|
500-hPa analysis valid 00 UTC 7 May 2000 |

|
The maximum vertical motion and precipitation associated with the MCS typically occurs near the center or slightly downshear (Davis and Weisman 1994). Often, during the day, the convection is removed from the center and occurs along outflow boundaries. However, at night it tends to shift towards the circulation center and typically occur near or just to the northeast of it. The ability of an MCV to initiate convection appears to be related at least in part to shear. Weak shear confined to the lowest layers of the atmosphere seem to the be the optimal conditions for subsequent convective development (Davis and Weisman 1994) |
|
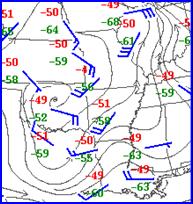
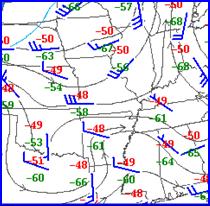
250-hPa analysis valid 12 UTC 6 May |
|
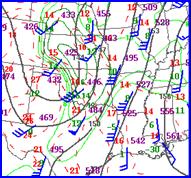
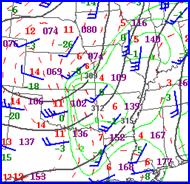
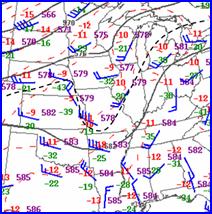
850-hPa analysis valid 12 UTC 6 May 2000 |
|
700-hPa analysis valid 12 UTC 6 May 2000 |
|
A mesoscale convective vortex exercise |
|
The circle on the 500-hPA analysis below is the location where a mesoscale convectively induced vorticity center was located at 12-UTC. |
|
From the four maps above, which is the truest statement about the MCV. |
|
A) |
|
The 850 wind field across eastern OK and MO is strong enough to suggest there will be too much shear for the system to maintain itself into the evening. |
|
B) |
|
The lack of shear in the mid and upper levels suggest that the MCV may be able to maintain itself through the day so it should be watched closely during the afternoon and evening for possible convective development. |
|
250-hPa analysis valid 00 UTC 7 May 2000 |
|
Obviously from the pictures above, the MCV did maintain its identity. The lack of shear at mid and upper levels allow it to maintain the circulation. Having relatively strong low level winds is not that detrimental to MCVs. |
|
700-hPa analysis valid 00 UTC 7 May 2000 May 2000 |
|
Analyzing the 579 decameter height on the 500-hPa plot (see above left) suggests that the vorticity center still is well defined. The shear between 700 hPa and 250-hPa remains fairly weak at mid and upper level data. Note that the winds that are implied across eastern Missouri are all the 20 to 25 knot range from 700-hPa to 250 hPa. The big question becomes whether new convection will form during the evening. |
|
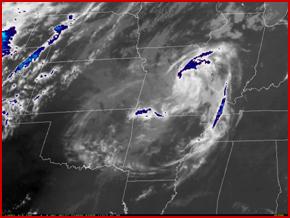
0000 UTC visible satellite imagery |
|
0000Z UTC infrared satellite imagery |
|
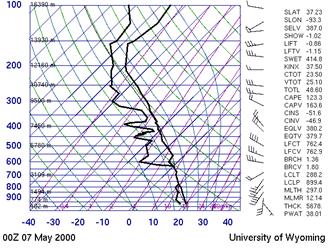
Look at the 00 UTC sounding for SGF and decide which are the most important and representative fields on the sounding of the surrounding environment. |
|
The saturated and unstable layer between 800 and 650 hPA? |
|
The 123.3 J/kg CAPE? |
|
The 40 knot southwesterly winds at around 850 hPa? |
|
The vertical wind structure? |
|
A) |
|
B) |
|
C) |
|
D) |