|
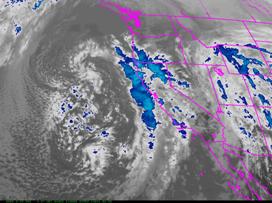
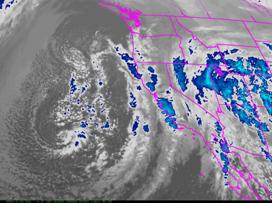
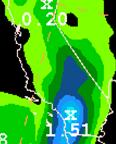
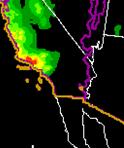
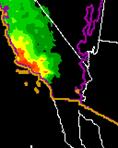
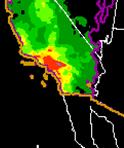
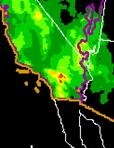
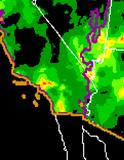
The distribution of rainfall along the coastal mountains, Sierra and Cascade ranges sometimes are also modulated by narrow but intense bands of associated with the front (Reynolds, 1996). The complex structure that sometimes occurs during these storms is illustrated by the two IR satellite images of the Dec. 28, 2004 heavy rainfall event. The images also suggest how difficult it can be to predict correctly in which 6-hr period the heaviest rainfall will occur as there sometime are periods of subsidence between bands. For example, at 1500 UTC 27 December the band right on the coast shows more enhancement than the next band of brighter clouds to its west but by 2100 UTC the initial band has weakened while the clouds in the second band have become enhanced and are obviously associated with convection. |
|
GOES IR imagery v.t. 2100 UTC 27 Dec. 2004 |
|
A second maximum was fairly well forecast and was associated with the initial mid level trough opening up. By this time, the model was predicting unstable LIs (not shown). Having a break between the two heaviest period of heavy rainfall is not all that uncommon in a case where a vorticity maximum and the cold pool aloft shift over the region behind the main baroclinic band. |
|
The area of apparent subsidence between the two bands also shows signs of cooling at 2100 UTC. However, the extensive convection within the band off the coast also suggested that the heavy rainfall might not be limited to near the crest of the mountains but could also fall right on the coast as this convection shifts into the coast. The GFS and NAM forecasts of the timing of the band of heaviest precipitation differs (see below). Resolving the differences between the timing is often problematic. In the shortest time ranges (0-12 hrs) satellite imagery can sometimes be useful. However, at longer time ranges, the best bet is often to rely on the consensus of all the operational models and ensemble members to time the bands. |
|
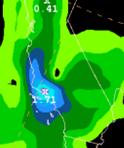
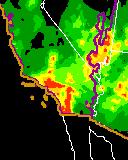
30-hr GFS 6-hr precipitation v.t. 1800 UTC 28 Dec. 2004. |
|
All the answers but “A” and possibly “D” are good answers. During post frontal situations along the west coast, the flow often is fairly uniform with little veering and blocking, also cold mid-level temperatures often lead to instability. Answer D is tricky as deep southwesterly flow is conducive to enhanced orographic precipitation. However, a barrier jet can form with the jet being parallel to the mountains. When this occurs, some blocking of flow is likely which can lead to rainfall occurring upstream of the mountains. Strong veering with heights is favorable for blocking (answer B). In these cases the heaviest rainfall still may be near the mountain tops but there is often moderate to heavy rainfall upstream from the mountains (see the figure on the previous page). Strong frontogenesis (answer C) in conjunction with instability often allows heavy rainfall to spread downstream from mountain barriers, in this case the coastal mountains allowing moderate to heavy rainfall to occur in the valley. |
|
GOES IR imagery v.t. 1500 UTC 27 Dec. 2004 |
|
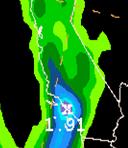
24-hr ETA 6-hr precipitation v.t. 1200 UTC 28 Dec. 2004. |

|
30-hr ETA 6-hr precipitation v.t. 1200 UTC 28 Dec. 2004. |
|
24-hr GFS 6-hr precipitation v.t. 1200 UTC 28 Dec. 2004. |
|
The 6-hourly RFC observed rainfall on the figures is an example of how the heaviest precipitation often evolves non-linearly. The first maximum that occurs during the 6-hr period ending at 1800 UTC appears to be related to orographic lifting from the southerly winds in advance of the front and the frontal band itself. Note that over 3 inches of rain was observed during the 6-hr period over the mountains near Los Angeles and that this maximum is underpredicted by either model at least when the precipitation is depicted at the 80-km resolution of the workstation. This again argues for looking at precipitation forecasts in complex terrain at the highest resolution possible. |
|
0600 UTC 28 Dec |
|
1200 UTC 28 Dec |
|
1800 UTC 28 Dec |
|
0000 UTC 29 Dec |
|
0600 UTC 29 Dec |
|
1200 UTC 29 Dec |
|
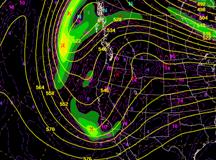
ETA heights and vorticity v.t. 0900 UTC 29 Dec. |
|
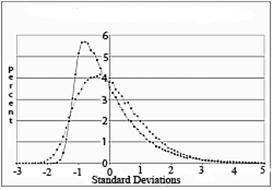
Hart and Grumm (2001) have used standardized anomalies to rank synoptic scale events from a climatology developed from the NCEP reanalysis. The standardized anomalies essentially scale the anomaly by the its standard deviation from the mean. The beauty of using standardized anomalies (SDs) is that the standard deviation provides information about the frequency of occurrence of whatever forecast parameter than you are looking at. As noted by Grumm and Hart (2001), a departure from normal of 2.5 SDs implies that the observed value occurs between 5% and 16% of the time. For fields like 500-hPa or 700-hPa heights the actually confidence limit is probably close to that of a normal distribution of 5%. Neither precipitable water (PW) nor the magnitude of 850-hPa magnitude of the moisture flux (MF) have a normal distribution, but even they appear to have confidence limits near that of a normal distribution. Note how over 99 percent of the time, the PW and 850-hPa magnitude of moisture flux is below 3 SDs. |
|
Using climatological anomalies as a forecast tool along the west coast. |
|
Magnitude of moisture flux |
|
Precipitable water |
|
Histogram showing the percentage of the distribution of PW and 850-hPa magnitude of moisture flux. |
|
From Junker et al. 2007 |
|
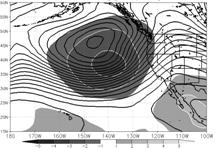
The 700-hPa height and standardized anomaly pattern for three different multi-day extreme rainfall events are shown below. Note that each has a greater than 3 SD height anomaly off California associated with it. The greater than 3 SD departure from normal suggests that 99% of the time during this time of year, the 700-hPa geopotential height anomaly is less than the observed anomalies during these three events. |
|
700-hPa geopotential height and standardized anomaly of the height field (shaded) valid 0000 UTC 9 Jan 1995. |
|
-3 SD |
|
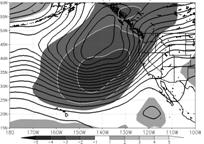
700-hPa geopotential height and standardized anomaly of the height field (shaded) valid 1200 UTC 9 Mar 1995. |
|
-3 SD |
|
-3 SD |
|
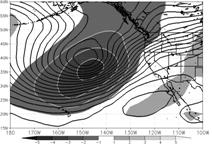
700-hPa geopotential height and standardized anomaly of the height field (shaded) valid 1200 UTC 31 Dec 1997. |
|
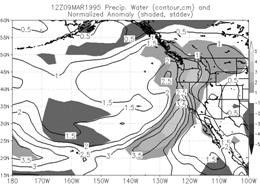
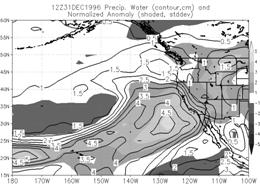
Heavy west coast precipitation events during winter usually are associated with a fairly strong negative anomaly with a weaker positive height anomaly to the southeast. All three of these multiday extreme rainfall events were associated with such a pattern which pretty much assures a strong southwesterly geopotential height gradient. The strong gradient between the two anomalies and the southward displacement of the jet helped pull and plume of moisture or atmospheric river northeastward into the coast. Note that during both the March 1995 and Dec. 31 events, that precipitable water values exceeded 3 standard deviations. |
|
1200 UTC 9 Mar 1995 PW (contour) and Normalized PW anomaly (shaded, unit=1 SD. |
|
1200 UTC 31 Dec 1997 PW (contour) and Normalized PW anomaly (shaded, unit=1 SD. |
|
3 SD |
|
4 SD |

|
Southern California case continued |