|
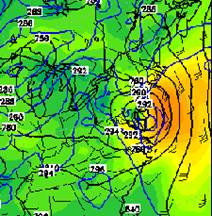
925-hPa height and winds (black), temperature (blue lines, oK), valid 1500 UTC 13 July 1999 |

|
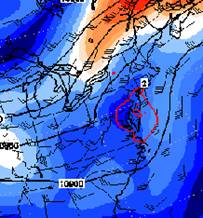
250-hPa winds and heights valid 1500 UTC 13 July 1999 |
|
Back to Bertha, the thermal structure of the system slowly changed during the next 15 hours and by 15 UTC July 13, a thermal boundary developed which promoted low level warm advection (the area enclosed by the thick back line). By then, the 925-hPa absolute vorticity (red lines) looks like it is being captured by a weak negative tilted trough (axis is defined by magenta line). The upper trough and low level thermal boundary are both much weaker than during Floyd. |

|
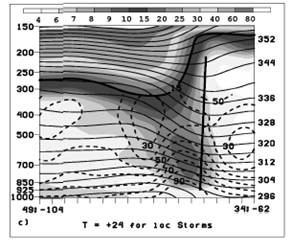
The Atallah et al. composite cross section for ROT versus LOT shows several marked differences. The area of high relative humidity on the ROT cases is deeper than on the LOT case composite suggesting upright convection might be the dominant type of precipitation. The warm core (thick black line) on the ROT composite is not as well defined at lower layers as on the LOT composite and there is actually a weak cold pool at the lowest layers. The authors caution that the cold pool may be a function of the lack of resolution of the reanalysis data. However, the same cold pool was present in the NARR data during the period when the bulk of the rainfall was located to the right of Bertha’s track so the cold pool is probably present during at least a portion of the ROT cases. |
|
Rainfall maximum to right of track composite (ROT) |
|
Rainfall maximum to left of track composite(LOT) |
|
Cross section of PVU (shaded, starting at .4 PVU as given by the color bar), isentropes (thin solid lines, contoured every 3oK), relative humidity (dashed line contoured every 10%) for line onT+24 shown above . The thick solid line indicates the position of the warm core associated with the tropical system. |
|
In summary, the structure of a storm seems to determine whether the heaviest rainfall will occur to the left or right of the track. Storms interacting with upper level troughs, jet streaks and baroclinic zones tend to have their precipitation transition to the left side of the track. There is a deep frontal boundary clearly defined in the isentrope field on the LOT composite. No frontal structure is evident on the ROT composite. |
|
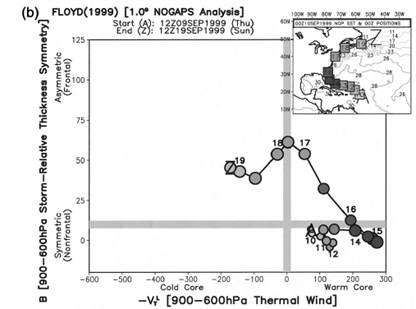
Another possible useful tool is the cyclone phase space diagram developed by Hart (2003). The diagram provides a tool to objectively diagnose whether the system is warm or cold core and whether the thermal structure will promote asymmetry. A sample of the product is shown below. The ordinate measures the symmetry of the system while the abscissa measures the thermal structure and whether the system has warm or cold core structure. The location of the storm at various times is given at the upper right hand corner of the figure. |
|
From Evans and Hart 2003 |
|
Note when Floyd was labeled with the number 16 it crossed the line between being a symmetric and asymmetric warm core system and that during the next 12 hours the storm became increasingly asymmetric. This was also about the time when the bulk of the precipitation transitioned to the west side of the track. The phase space diagrams provide a quick way to investigate the structure of a storm using model forecasts of the storm. When the diagram starts indicating that a storm is starting to become asymmetric, look closely at model diagnostic fields to see whether the storm is starting to transition. Also look for fronts and jet streaks to that might help focus the precipitation to the left of the storms track. |
|
Click here to look at the The Florida State University website with phase space diagrams |