|
Standardized anomalies are a useful but not a stand-alone forecast tool. They should be used as and adjunct to an ingredients based approach to assessing the pattern and its precipitation potential and that many heavy rainfall events are associated with convection and mesoscale and storm scale processes. However, they can give an idea of how unusual the pattern is. Below is the percent of the time that the distribution will fall within 2.00, 3.00 and 4.00 standard deviations (SD) based on the shape of the curved representing the distribution. While moisture flux and PW curves are skewed, they’re distribution within various standard deviations remains closer to the bell shaped than to the distribution based on Chebyshev’s inequality. Therefore, a 2 SD anomaly is a relatively uncommon event and a SD of greater than 4 is a rare event. |
|
A forecast exercise, using pattern recognition and ensemble guidance to predict a heavy rainfall event. |
|
First we’ll use the forecast funnel approach espoused by Snellman (1977) and look at the synoptic scale pattern and compare it to the synoptic type flash flood pattern discussion on the previous page. Well then look at various ensemble forecasting system products to see how they can possibly be used during a potential rainfall event. |
|
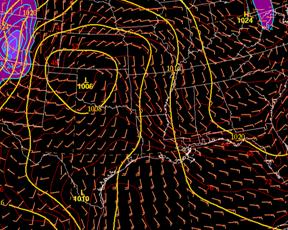
12 hr NAM surface pressure and boundary layer wind and temperature v.t. 1200 UTC Oct. 26, 2006. The thick red lines is a warm frontal position. |
|
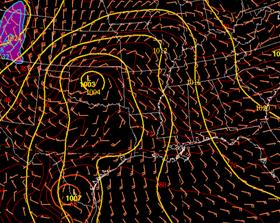
24 hr NAM surface pressure and boundary layer wind and temperature v.t. 0000 UTC Oct. 27, 2006. The thick red lines is a warm frontal position. |
|
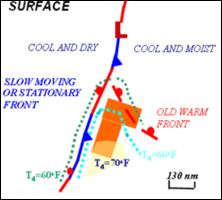
A fairly cold airmass was located over the east and the NAM and GFS predicted the development of a low to the lee of the Rocky Mountains in western Oklahoma. The remains of an old frontal boundary was located over Louisiana. This boundary was predicted to move very little during the 12 hours between the two forecast maps shown above. South of the warm front, surface dewpoints were forecast to be above 70oF to the south of the warm front across eastern Texas and over the western Gulf of Mexico. There is also a cold front moving across west Texas with a surface trough to its east. Having a prefrontal trough is a common variation of synoptic type event as it moves east of the Rocky Mountains. Compare the pattern to the surface pattern for a synoptic scale heavy rainfall event (below left). |
|
Schematic diagram of surface pattern for Maddox et al. (1979) heavy rainfall events. |
|
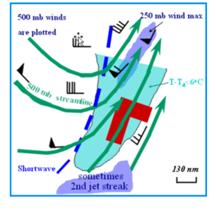
Schematic diagram of upper level pattern during Maddox et al. synoptic type events. Green lines are 500-hPa streamlines, winds are at 500-hPA, light blue is location of 250-hPa wind maxima. |


|
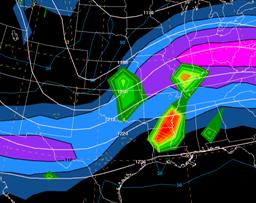
27hr GFS 250 heights and isotachs valid 0300 UTC 27 Oct 2006. |
|
The forecast upper level pattern is also a close match for a synoptic type heavy rainfall event. A strong, positive tilted trough is moving eastward towards the area. The 250-hPa isotach pattern shows a double jet structure with the right entrance region of the jet being near the threat area which extends across eastern Texas into Arkansas and Louisiana. |
|
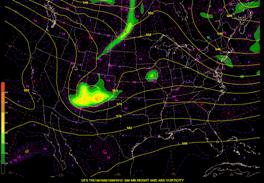
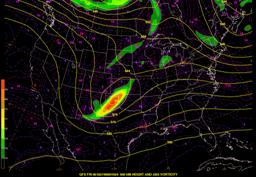
12hr GFS 500-hPa heights and vorticity valid 1200 UTC 26 Oct 2006. |
|
588 |
|
576 |
|
564 |
|
588 |
|
576 |
|
564 |
|
27hr GFS 500-hPa heights and vorticity valid 0300 UTC 27 Oct 2006. |
|
24 hr GFS 850-hPa wind and PW forecast valid at 0000 UCT 27 Oct. 2006. |
|
The forecast 850-hPa winds and precipitable water also support a synoptic event. During the night, the 850-hPa winds are forecast to strengthen to 45 to 50 kts across Louisiana. The over 2.00” PW values predicted across Louisiana are significantly higher than the average 1.46” found by Maddox for such events. |
|
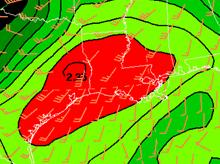
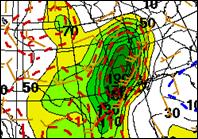
15-hr SREF ensemble mean forecast of PW (brown, inches) and standardized anomaly of PW (dashed red) valid 1200 UTC 26 Oct. 2006. |
|
27-hr SREF ensemble mean forecast of PW (brown line, in inches) and standardized anomaly of PW (dashed red) valid 0000 UTC 27 Oct. 2006. |
|
Model forecast of various fields can be assessed to see how unusual such high values are for that field. Ensemble mean forecasts can be very useful at times. When an ensemble mean shows very high values of precipitable water, a strong low-level jet and moisture flux, it signals that the majority of members are predicting similar timing and evolution of those fields since ensemble means typically smooth features. This smoothing usually decreases the maximum value and often broadens the field. For example, verification of ensemble mean precipitation forecasts exhibit a high bias for low precipitation thresholds and a low bias for higher amounts (1.00” or greater amounts). For more information on using ensemble forecasts see http://www.hpc.ncep.noaa.gov/ensembletraining/ and (http://meted.ucar.edu/nwp/pcu1/ensemble/print.htm).
The ensemble mean forecast of PW and its normalized anomaly for the Oct. 2007 events are shown below. The ensemble mean forecast showing PWs above 2.00 indicates that there is a lot of agreement among individual members that the PW will exceed 2.00 inches. The mean suggests that the majority of the members are predicting PW values significantly higher than the average value found by Maddox for synoptic type events. |
|
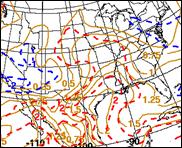
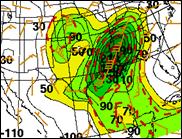
15-hr SREF ensemble mean forecast of 850-hPa magnitude of moisture flux (scale at left, (g/kg)(ms-1), standardized anomaly of magnitude of moisture flux (dashed red) and 850-hPa wind (barbs). |
|
27-hr SREF ensemble mean forecast of 850-hPa magnitude of moisture flux (scale at left, (g/kg)(ms-1), standardized anomaly of magnitude of moisture flux (dashed red) and 850-hPa wind (barbs). |
|
The standardized anomalies, especially of the magnitude of the moisture flux suggested this could be a significant event. Based on the greater than 4 SD anomaly, over 99 percent of the time that the observed moisture flux values during the same time of year will be lower than the forecast values. They anomalies are suggesting this will not be a run-of-the-mill rainfall event. |
|
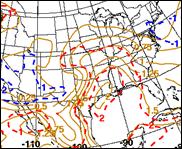
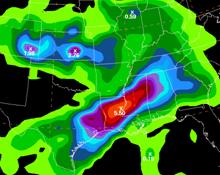
12-36 hr GFS QPF valid 1200 UTC 27 Oct. 2006. |
|
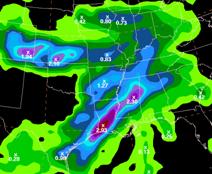
12-36 hr NAM QPF valid 1200 UTC 27 Oct. 2006. |
|
Also, the SREFS ensemble mean forecasts of normalized anomalies suggested that the heavier amounts predicted by the GFS were more likely than the NAM maximum amounts. However, the high anomalies do not really aid in pinpointing the precise region where the maximum rainfall. The location is usually determined by low-level boundaries that help focus the low level convergence. |
|
That both the GFS and NAM forecast heavy rainfall across the region from eastern Texas across Louisiana into Texas is no surprise. In a sense, the two forecasts provide two members of an ensemble. Ensemble products provide an estimate of the uncertainty of the event and can provide a rough idea of the probability of an event occurring. In this case, the operational models indicated there is a high likelihood of a heavy rainfall event but differ on how heavy and where the maximum might be located. Ensemble forecasts from the SREF and GEFS are additional tools that can and should be used to assess the likelihood of this being a significant rainfall event. |
|
Normalized anomaly |
any shape |
Bell curve |
|
2 S.D |
75% |
95.4% |
|
3 S.D |
89% |
99.7% |
|
4 S.D |
94% |
99.99% |