|
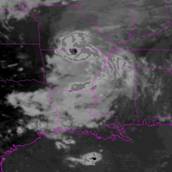
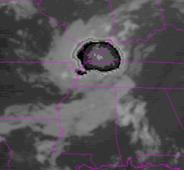
IR imagery valid 1800 UTC 4 Sept. 1985 |
|
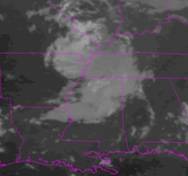
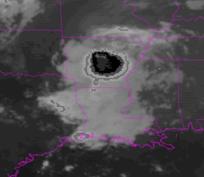
IR imagery valid 0400 UTC 5 Sept. 1985. |
|
The convection weakened and by 0400 UTC 5 Sept. cloud debris remained. The NARR analysis below indicates there was still a vorticity maximum and a 30 kt or greater low-level jet. Interestingly enough, despite these features the NARR |
|
0900 UTC 5 Sept NARR 500-hPa heights and vorticity analysis. |
|
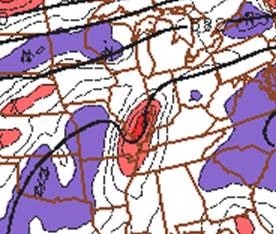
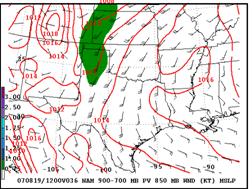
925 mb MF (color fill), wind (kts), 900-700 PV (red line) valid 1200 UTC 5 Sept 1985. |
|
analysis showed little in the way of upward motion at 0900 or 1200 UTC even though another round of convection and heavy rainfall developed which produced another small area of greater than 7 inch rainfall. |
|
GOES IR satellite imagery valid 1000 UTC 5 Sept. 1985. |
|
More recently, Tropical Storm Erin showed a similar diurnal cycle to its convection though it maintained some convection throughout the day as the storm tracked across Texas into Oklahoma. However, it lost its surface center but still produced heavy rainfall over southwestern Missouri. The interaction of low level jet with the mid level vorticity associated with the remains of the storm again appeared to play a critical role in producing the resulting heavy rainfall event (Schumacher and Johnson 2008). The interaction between mid level vorticity and the low level jet also appears to play a role in MCVs that produce heavy rainfall. |
|
GOES infrared imagery valid 1000 UTC 4 Sept. 1985. |
|
Once convection develops, potential vorticity (PV) is increased in the low levels and decreased near the cirrus anvil. Comparison between the PV on the cross sections at 0600 UTC and 0900 UTC 0600 UTC above clearly show this change while also suggesting that the moisture flux at 950-hPa increasing during this period. A compact MCS developed just n of the area of strongest moisture transport near the southern end of the layered PV maximum. It produced over 7 inches of rain. |
|
One complicating factor when dealing with weak or decaying tropical systems is that numerical models can have problems forecasting the magnitude and placement of the precipitation and also have problems maintaining the mid-level vorticity center. Model forecasts of precipitation often differ significantly depending on the convective parameterization scheme that is used. In the case of Erin, the NAM, |


|
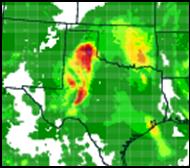
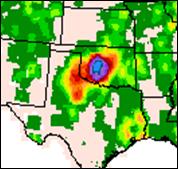
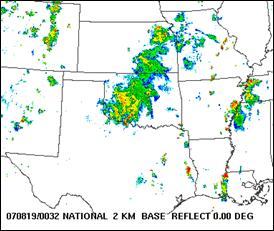
12-36 hr accumulated precipitation (in mm) for the period ending 1200 UTC 19 August 2007, NAM forecast (top left), GFS forecast (bottom left). Verifying precipitation (top right). |
|
underpredicted the precipitation and at times lost the low-level circulation center. It’s PV maximum was much more poorly forecast than the PV maximum forecast by the GFS. The lack of rainfall and the associated latent hear release negatively impacted on the low level circulation center and low level jet which subsequently helped feed the next round of convection which re-strengthened the PV center each night. Note how the wetter GFS had a stronger PV maximum and better track of the PV maximum even though it was slow moving it northeastward (see below). |
|
Elena continued |
|
The bottom line is don’t give up on the remains of a tropical system when it still has a well defined mid-level center, is embedded in an area of high relatively humidity and precipitable water, especially if a decent low level jet is present to interact with the PV maximum |


|
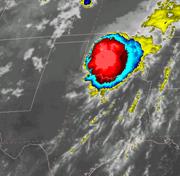
GOES IR imagery of the remains of Erin valid 1800 UTC 18 August 2007 (left), 0000 UTC 19 August (center) and 0600 UTC 19 August (right) |
|
Another example, Erin |
|
Which of following are usually associated with MCVs or decaying tropical systems that have convection redevelop near the circulation center.
1) stronger low level winds than the mid and upper level winds. 2) High relative humidity and near saturated conditions 3) An area of negative saturated EPV (equivalent potential vorticity) 4) A hodograph with a coat-hanger bend 5) A well defined mid-level vorticity center |
|
The correct answer is all are typically present though the models may lows one or more of them during it’s forecast cycle if it mishandles the convection. |
|
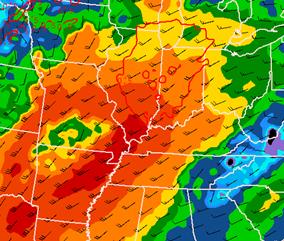
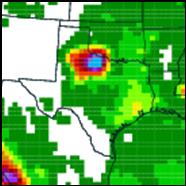
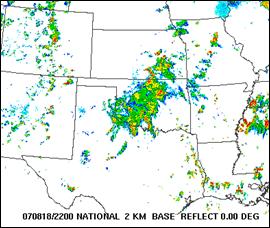
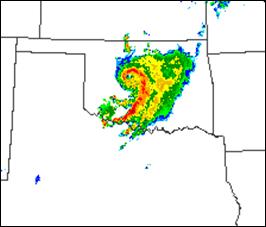
1004 UTC 19 August radar |
|
The remains of Erin strengthened due to the diabatic feedback during the diurnal flare-up of convection near the center. Watonga reported sustained winds of 52 mph and had sustained tropical storm force winds for the better part of three hours. |