 |
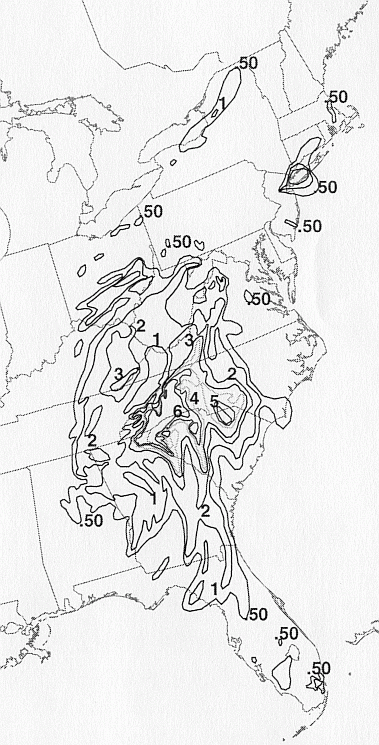
In-house and Stage IV quantitative precipitation estimates (a QPE example from Frances of 2004 is seen on the left), radar imagery, satellite imagery, daily
weather maps,
and tropical cyclone reports are used to
figure out brackets of dates where tropical cyclone rainfall is deemed to have fallen, either within latitude/longitude
boxes during the real-time graphics over the past several years, or state by state in older cases. The point rainfall data comes from the National
Climatic Data Center (NCDC) or xMACIS2 for many cases, from River Forecast Center real-time rainfall collectives, from local mesonets
where there is
authorized access
to the data, like CoCoRaHS and South Florida water management
district, and other published sources. All this data is entered into Excel spreadsheets, and a
script is run to process the
file for plotting within the nMap2 software system in use at the
Weather Prediction
Center (WPC). Image Magick software is used to create a .gif file
of the rainfall isohyetal
map, and Paint software is used to create to color-filled
graphics. If
mesonets are used in the
storm total graphics, it is stated within the cyclone's rainfall page
and within the related
spreadsheets. Once the low has
formed, rainfall becomes included within the graphics, and continues for as long
as the low exists. If a tropical disturbance predates the low
formation, the storm total rainfall window is extended backwards to
account for the pre- existing disturbance. The same is true for
remnant mid-level shortwaves or mesoscale
convective vortices (MCVs) associated with a
weakening TC. Tracks
for "remnant disturbance" or "incipient disturbance" are included
on the rainfall
maps. This
procedure causes
occasional differences between rainfall amounts of the associated
graphics/files within this project, and the
tropical cyclone reports issued by the National Hurricane Center (NHC). |
|
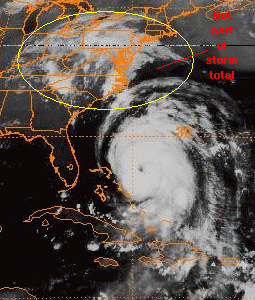
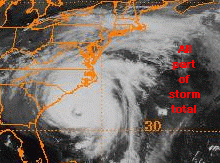
If the precipitation area
between a tropical cyclone and a nearby front is merged, all the rainfall is
included within the graphics. If there is separation between the
tropical cyclone and precipitation
along a draping frontal zone well to its north or northeast
(also known as PRE rainfall), the distant PRE rainfall activity is not included in the storm
total rainfall. Same is true with nearby upper lows and tropical
cyclones. This is why the excessive rainfall in New England, and
the resultant flooding,
indirectly due to Lili (1996) is not included within the graphics for that system, but rainfall up
into the Mid-Atlantic states for Hilda (1964) would be. For the
same reason, it's why the precipitation pattern related to Hermine
(1998) is much more expansive than the small size of the system might
indicate, since the precipitation pattern between the nearby upper low
and the tropical cyclone showed no separation. As for Fran
(1996), this means the first 8" or so of rainfall across the Mid-Atlantic was not
included, since there was separation between the precipitation from the
upper low and the approaching tropical cyclone until nearly the time
of landfall. As long as a surface low from a former tropical cyclone
(extratropical or remnant low) remains discernible, rainfall continues
to be included.
This has forced continuations of tracks within the Atlantic
and Pacific hurricane databases (also known as HURDAT). |