During the first several days of June, a surface low moved slowly up a sharp surface trough
which slowly retrograded through the western Caribbean sea. A few tropical waves moved
through the region during the low's development stage, the last of which departed Africa around
May 30th. By June 8th, an upper low organized within the upper level shear line to its west,
increasing outflow over the system. By the 10th, it became a tropical depression and by the 11th,
a tropical storm as it moved north into the southeast Gulf of Mexico.
Remaining sheared from the southwest for the duration of its life cycle, the cyclone would
develop a blowup of thunderstorms northeast of the center each night that would fade each day.
On the morning of the 12th, the center jumped northeast towards the convection, and it reached
its peak intensity of 70 mph. Leaving the loop current, the tropical storm made landfall southeast
of Tallahassee, Florida just after noon on the 13th. Slowly weakening over land, Alberto dropped
to tropical depression strength on the 14th shortly before becoming a nontropical frontal wave.
Below is its track, provided by the National Hurricane Center.
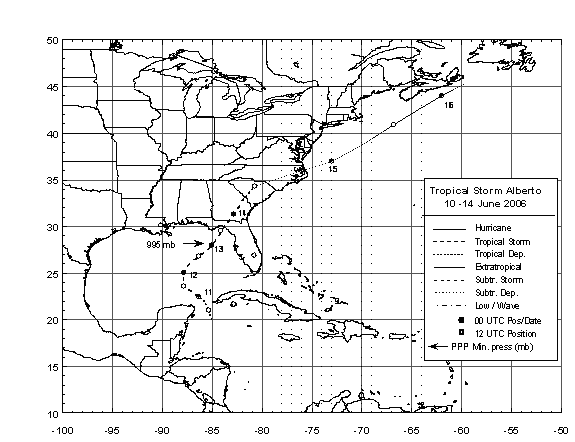
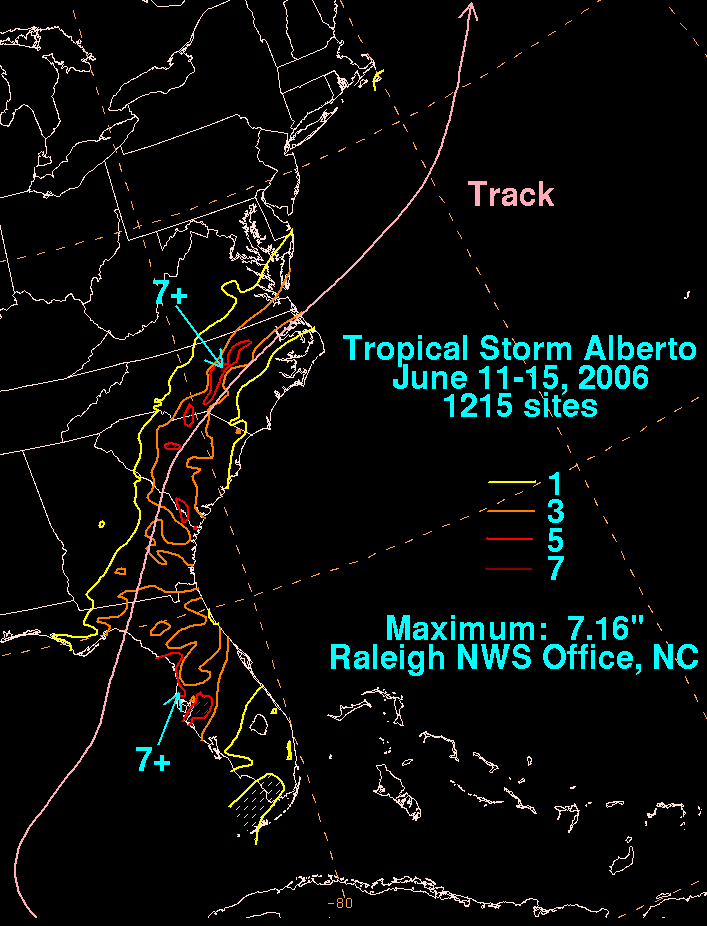
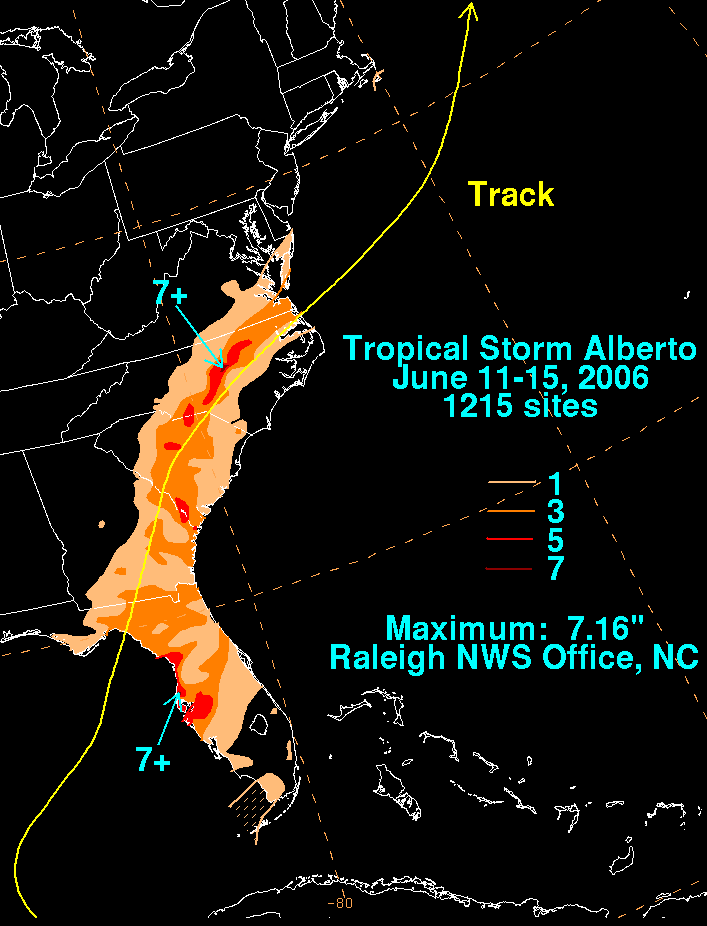
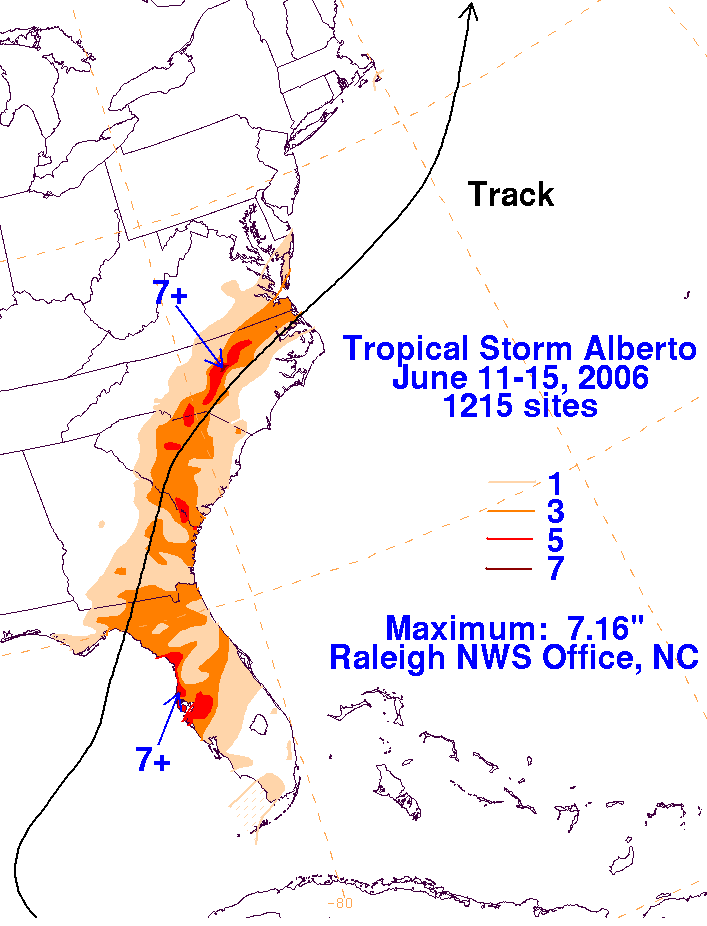
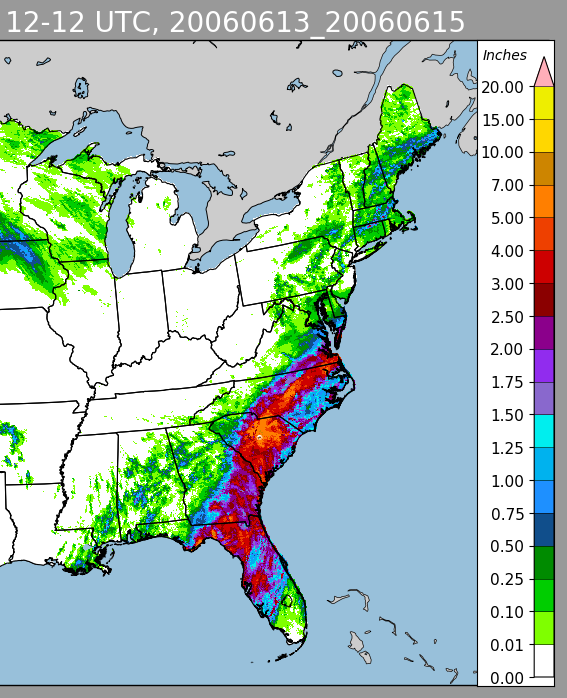
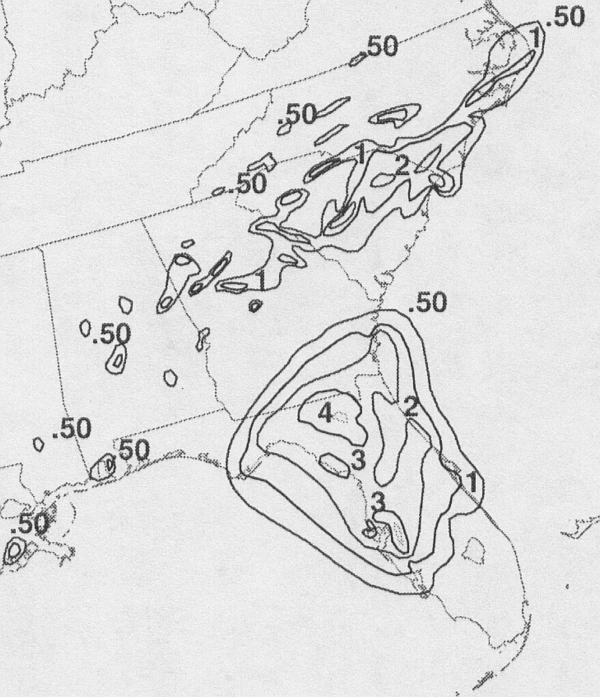
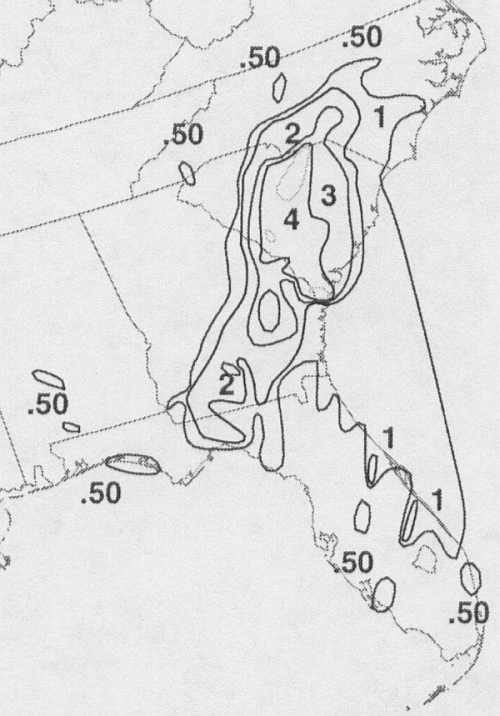
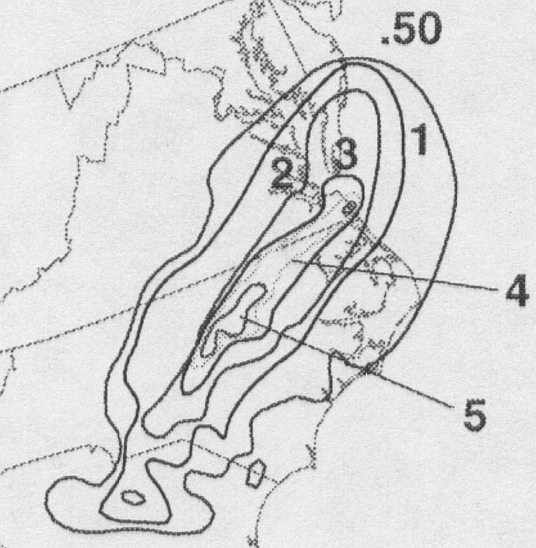
Its heaviest rains were saved for North Carolina after the transition completed, with 7.16 inches
falling at the National Weather Service Office in Raleigh, North Carolina. The cyclone then moved
offshore the deepened into an oceanic storm offshore New England, lashing eastern Canada with
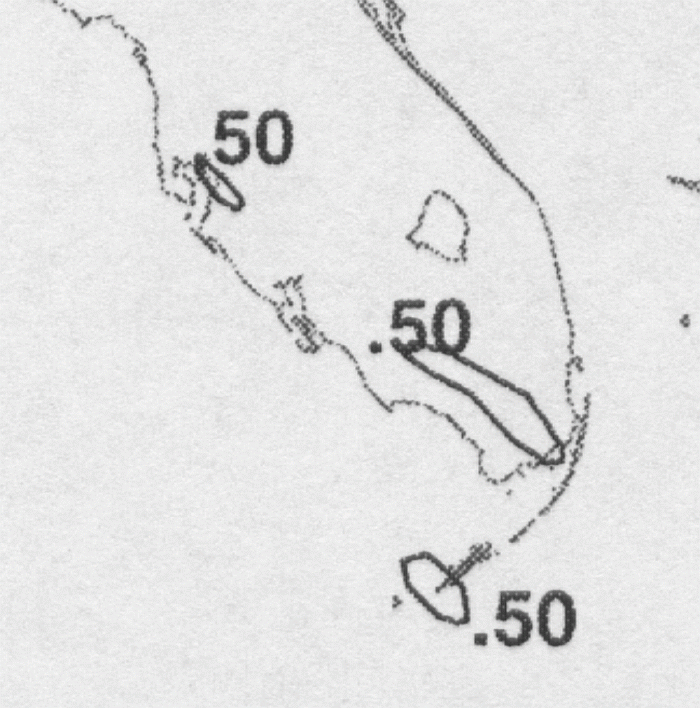
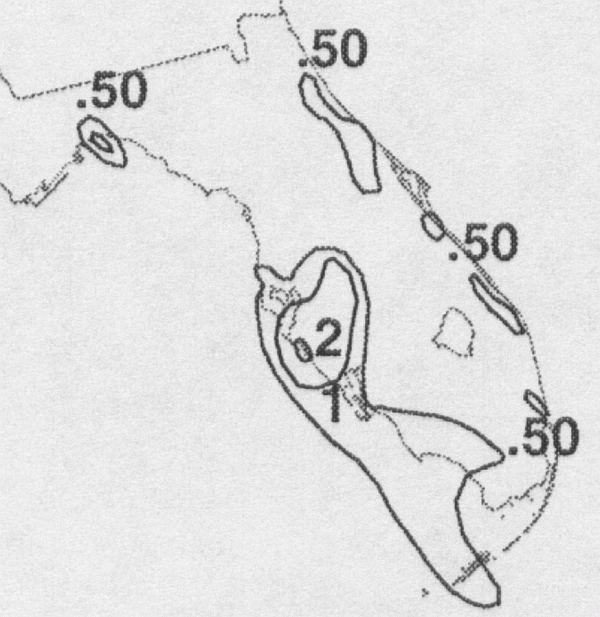
gusts near hurricane force. The graphics below show the storm total rainfall for Alberto. Note that the
maximum shifted from right of track to left of track while the system was transitioning into a frontal
wave over South Carolina.
The first three graphics were composed using rain guage observations while the fourth uses radar rainfall estimates with some input from rain guage observations.
 |
 |
 |
 |
Below are the calendar for Daily Precipitation Maps. Note that the 24-hour periods end
at 12z that morning.
| Sun | Mon | Tue | Wed | Thu | Fri | Sat |
| 11 |
12 |
13 |
14 |
15 |