A tropical wave moved off the west coast of Africa on August
5th.
It moved westward with no
development as it tracked through the tropical Atlantic and Caribbean
Sea. The wave crossed
the Yucatan peninsula on the 18th, as an upper low was moving in tandem
but ahead of the
wave axis. Development ensued, and a tropical depression formed
around noon on the 18th
in the Bay of Campeche. Wind shear slowed strengthening, but
the depression did manage
the become a tropical storm late on the 19th. The upper low
allowed
Bret to move north,
which was also through an area of very warm water temperatures.
It quickly strengthened
into a hurricane, and became a category four hurricane on the morning
of the 22nd, while
it was approaching Texas. Feeling the effects of a high pressure
ridge to its north, Bret
moved on a more westward course, and struck the least populated coastal
county in
Texas, Kenedy. It continued to move westward, and lost all
identity
at the surface by
th 25th, although its mid level vorticity maximum survived to move
westward another
few days. It was the first hurricane to strike Texas in ten
years,
and the first major
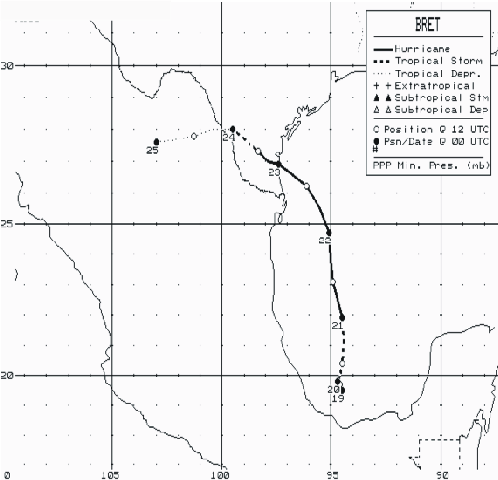
hurricane to hit the Lone Star State in 16 years. The track of
Bret is below, provided
by the National Hurricane Center.
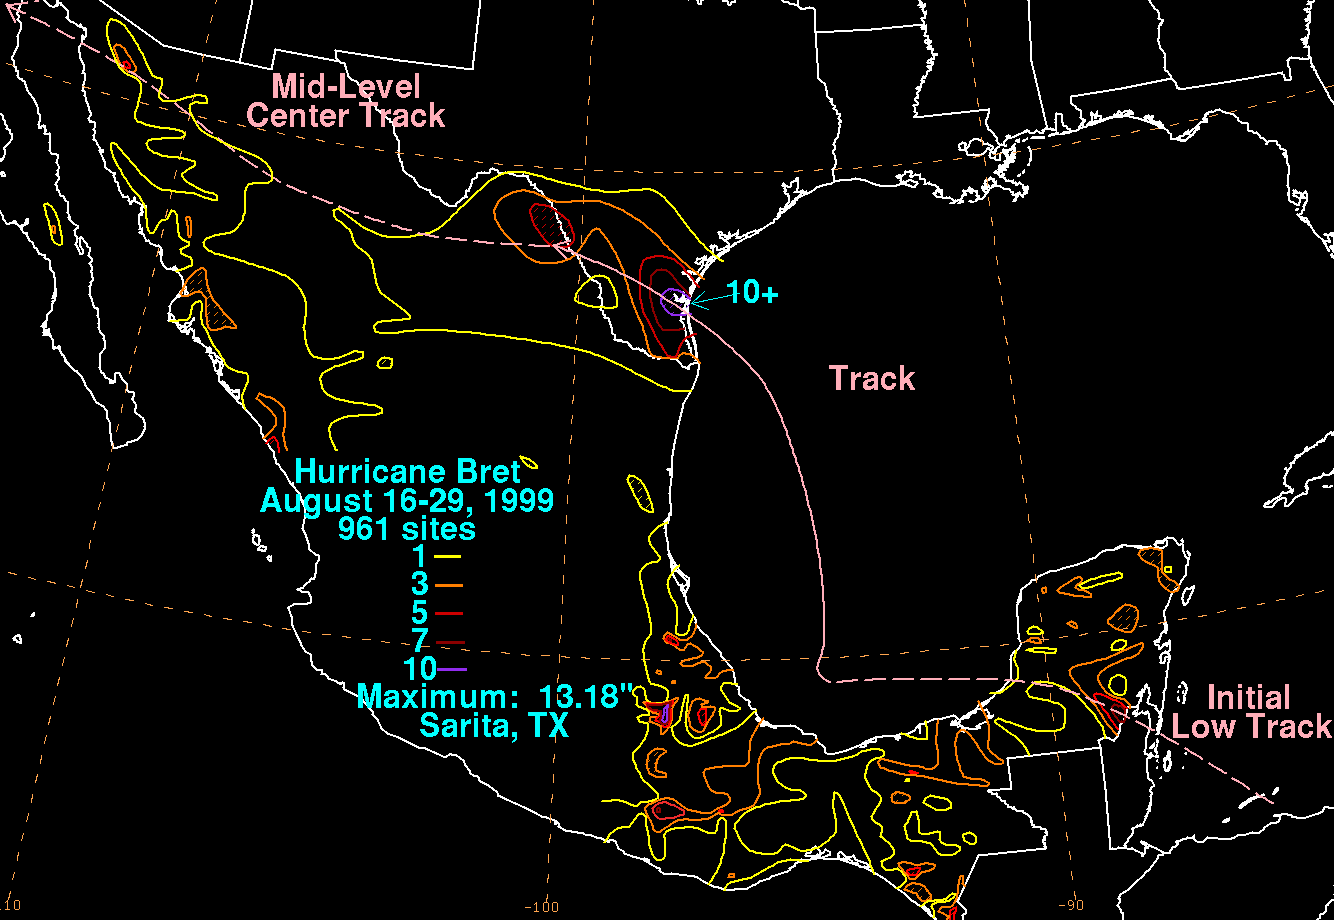
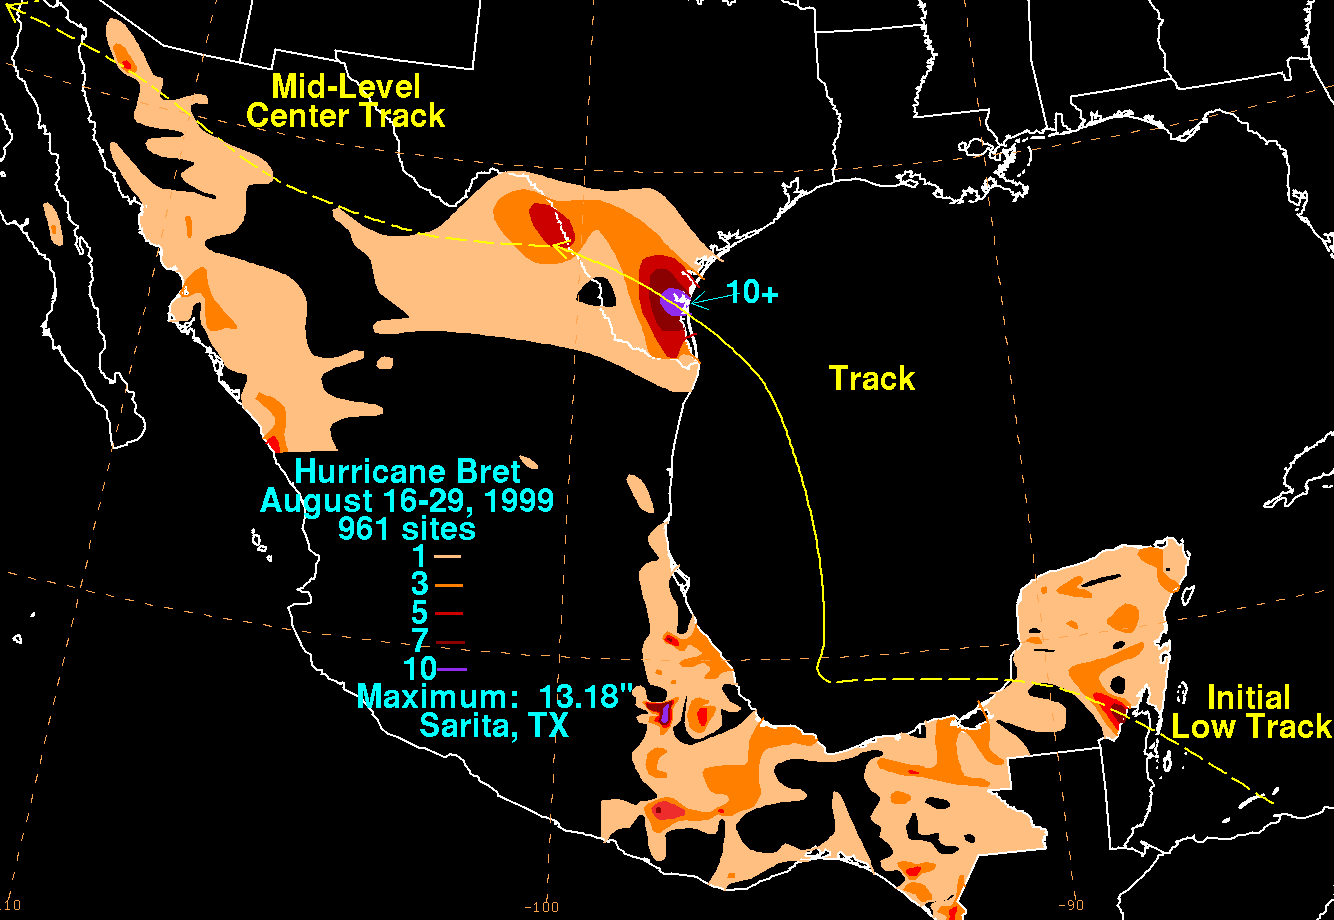
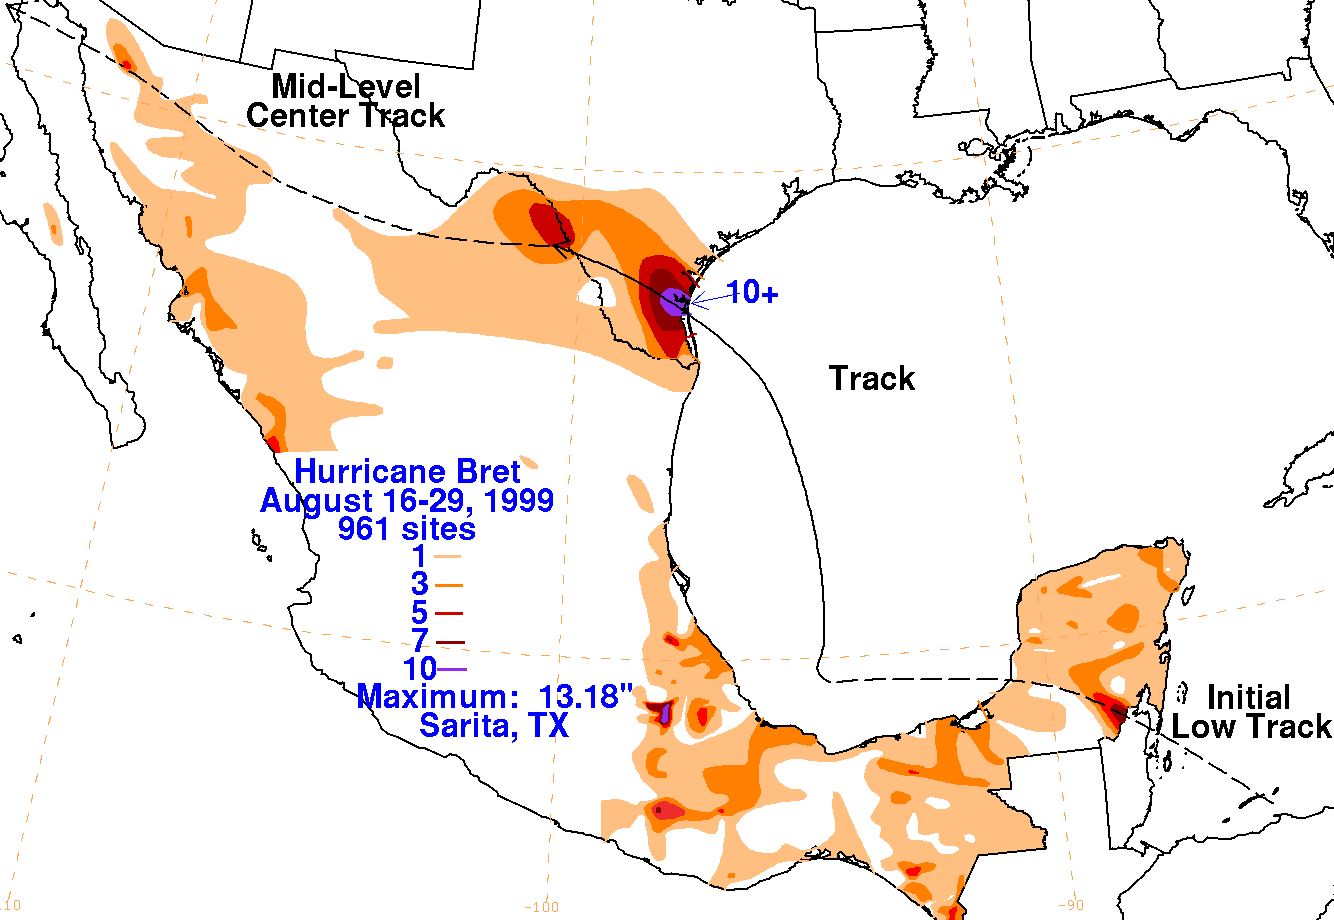
On the graphics below are the storm total rainfall for Bret.
Note
the maximum just
south of Corpus Christi, which is just to the right of where the storm
made landfall,
and a secondary maximum near Del Rio, as the circulation was forced
to go up the
higher elevation, squeezing out additional heavy rains. This
maps below were generated
using data provided by the National Climatic Data Center, the
Southern
Region
Climate Center, and Mexico's Comision del Agua, the parent agency of
their National
Weather Service.
 |
 |
 |
Below is the calendar for Daily Precipitation Maps. Note that
the 24-hour periods end
at 12z that morning (7 am CDT).
