A strong tropical wave moved off the west coast of Africa on August
17th. Thunderstorm was
persistent with the system as it crossed the tropical Atlantic.
A weak surface low developed as
it passed through the Lesser Antilles on the 23rd, but further
development
was thwarted by the
outflow of Hurricane Bonnie, at that time near the southeastern
Bahamas.
It emerged from the
shadow of Bonnie as it moved into the western Caribbean, and
strengthening
resumed. A closed
circulation in the wind and pressure patterns was seen in the southern
Gulf of Mexico on the 31st,
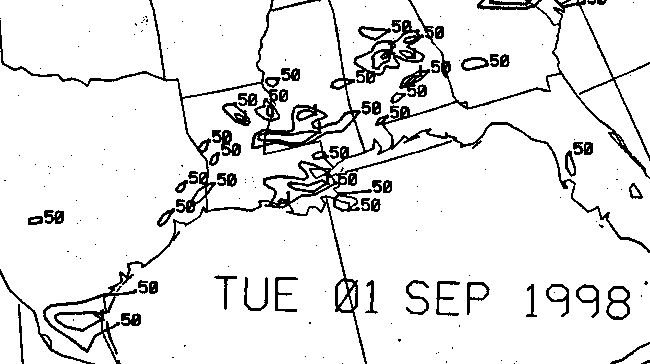
indicating the presence of a tropical depression. It has a broad
circulation pattern, similar to a
subtropical cyclone, with multiple centers and a large area of light
wind near the pressure center,
with strong winds to the north in the oil rig field off the
Louisiana/Texas
coasts.
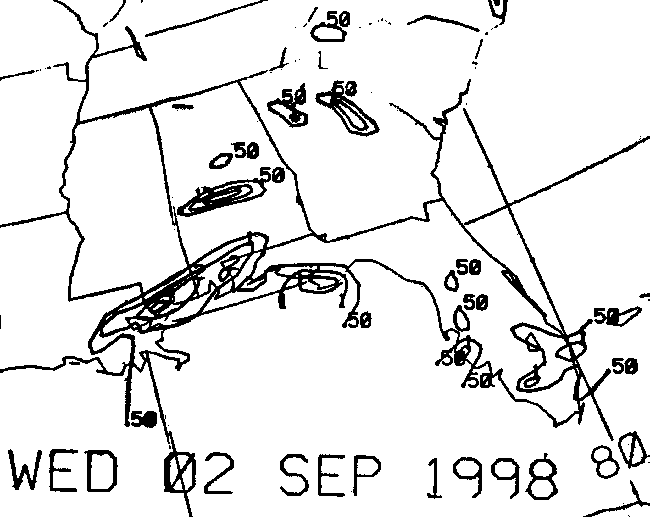
Becoming a tropical storm on the 1st, the system moved northeast to
the east of a sharp upper
level trough, which was unforecasted by the short range models.
As it reached its point of closest
approach to New Orleans (125 miles), Earl became a hurricane.
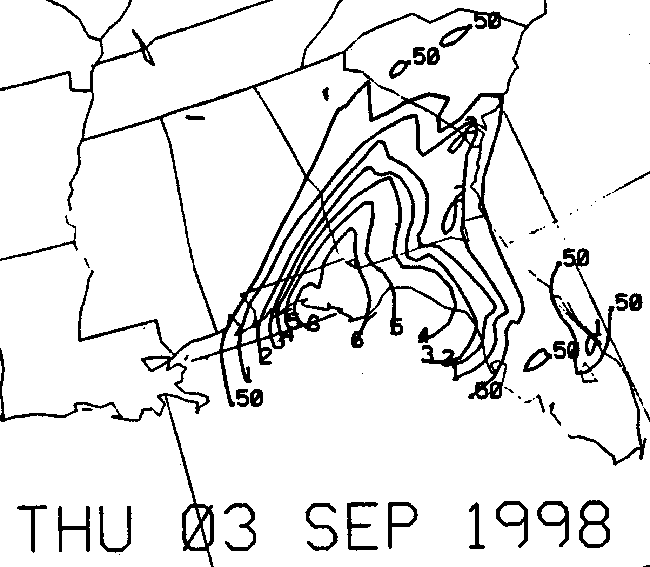
Earl remained highly elongated
with little extent of its rain shield to the northwest...giving
Louisiana
cool nights and hot days in a
regime of deep offshore flow. It peaked as a category two
hurricane
between the Mouth of
the Mississippi River and the Florida panhandle of morning of the 3rd,
before weakening as
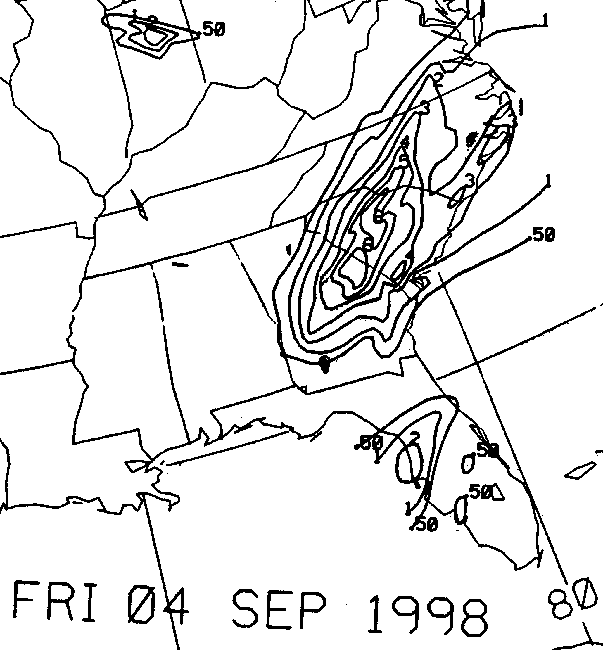
it made landfall near Panama City Beach, Florida. Earl
transitioned
into a subtropical cyclone
in southern Georgia on the 3rd, before moving northeast to terrorize
the shipping lanes of the
North Atlantic as a gale center from the 4th through the 8th.
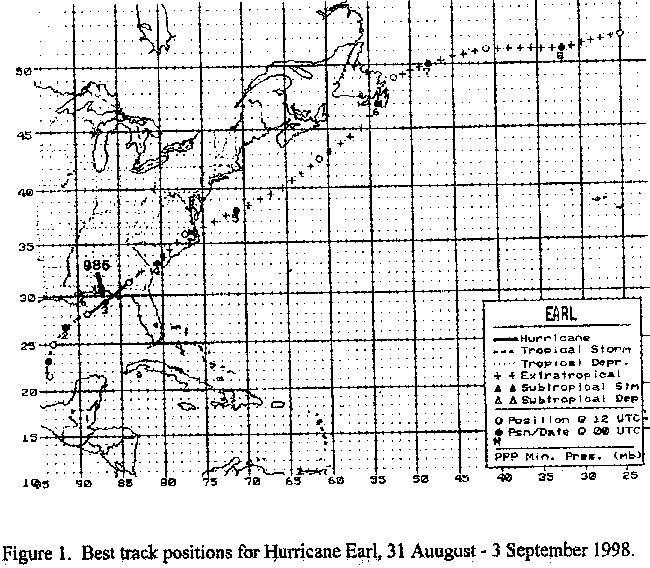
Its track lies below, courtesy of
the National Hurricane Center.
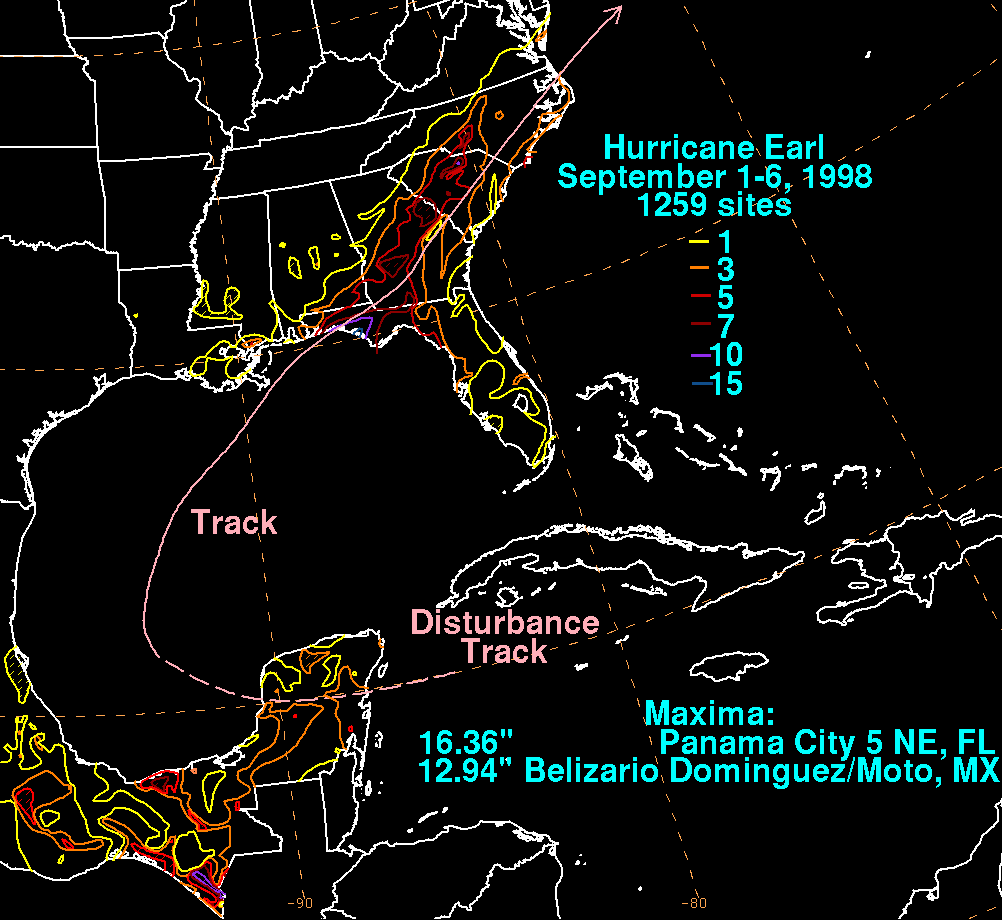
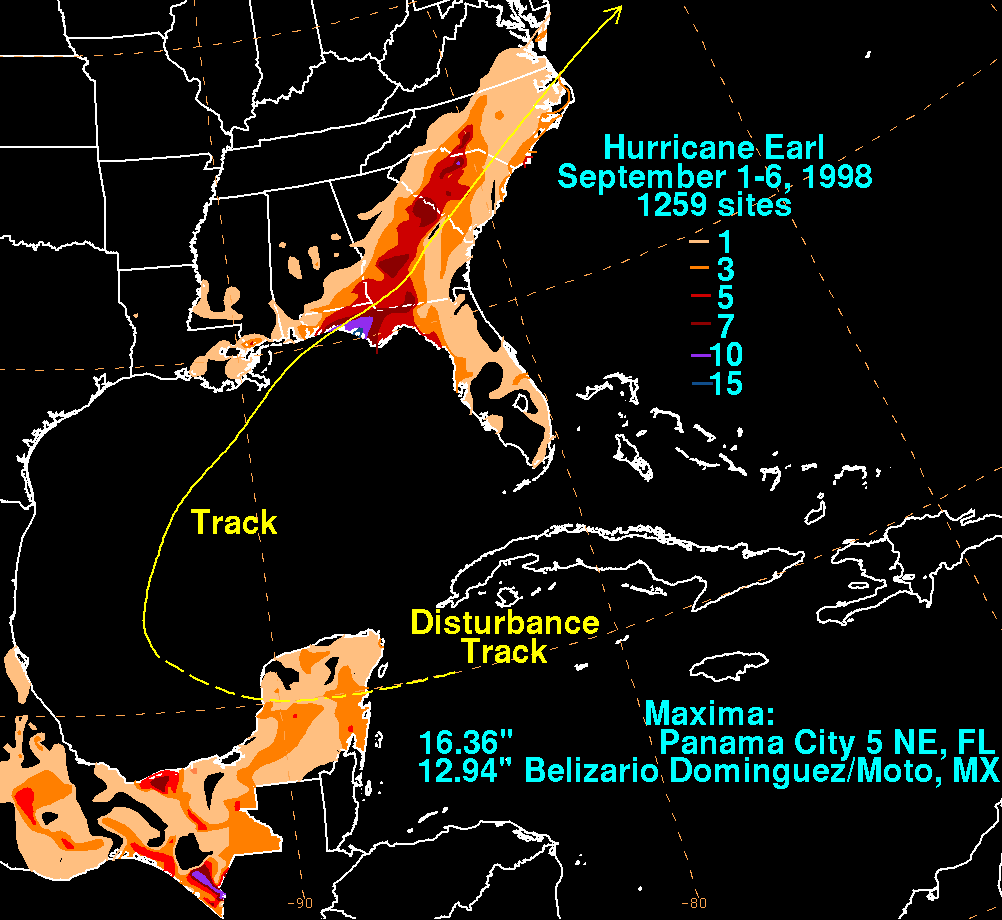
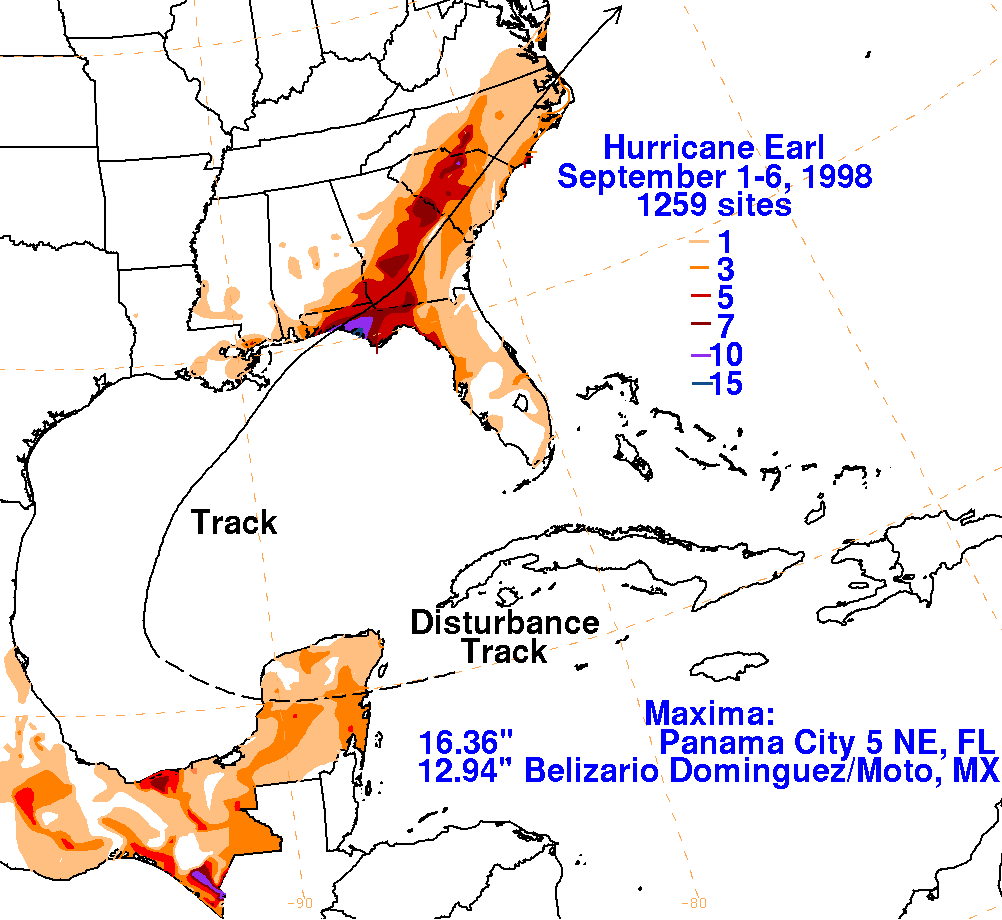
Below are the storm total rainfall maps for Earl. Note the
maximum
at and to the right of the point of landfall
in the Florida panhandle. A secondary maximum lies in a band
from central Georgia northeastward along
the Piedmont towards the Northern Neck of Virginia, to the left of
the storm's track. Data for the United
States was obtained from the National Climatic Data Center in
Asheville, North Carolina while data from
Mexico originated with the Servicio Nacional del Agua, the parent
agency of Mexico's National Weather
Service.
 |
 |
 |
Below is the calendar for Daily Precipitation Maps. Note that
the 24-hour periods end
at 12z that morning.