Hurricane Harvey -- August 25-September 4, 2017
The system that evolved into Harvey left the western coast of Africa as a tropical wave on August 13th.
On the 17th, thunderstorm activity began to show organization along the wave axis as a well-defined surface
low formed. The National Hurricane Center initiated advisories on Potential Tropical Cyclone Nine while it was
approaching the Lesser Antilles. On the afternoon of the 17th, aircraft information allowed for the system
to be upgraded to Tropical Storm Harvey. The storm moved westward through the Caribbean Sea and began to
experience vertical wind shear. The system degenerated back into a tropical wave on the 19th as it entered the
central Caribbean. The following day, convection along wave attempted to slowly gain organization as it approached
Central America. A low pressure area began to define itself as the system moved into the Yucatan Peninsula.
On the 23rd, Harvey regained tropical depression status in the Gulf of Mexico and quickly strengthened into
a tropical storm that night and a hurricane on the 24th. Harvey struck the Texas coast as a major hurricane
near Rockport, Texas on the night of the 25th, becoming the strongest hurricane to strike the United States
since Charley in 2004. Harvey weakened as it moved north-northwest toward central Texas. Regaining tropical storm
status on the 26th, Harvey slowed significantly east of San Antonio. Remaining within Texas borders for
60 hours, Harvey wrapped dry air around its southern and southeast portions of its circulation showing up as a dry
slot on satellite imagery and forcing convection with heavy rainfall into its northeast quadrant near Houston
near a thermal boundary, appearing extratropical. As Harvey moved east offshore Texas, thunderstorm activity began
to focus within its northern and northwestern quadrants which prolonged the heavy rainfall across southeast Texas
between the Sabine River and Houston.
Harvey moved back ashore across southwesternmost Louisiana on the morning of August 29. Harvey weakened to a tropical
depression during the evening of August 30 and continued tracking north-northeast, becoming fully extratropical on
September 1st. Harvey ceased being a heavy rain threat as its center moved across Ohio, and its remnant low
dissipated north of Lake Erie on the 3rd.
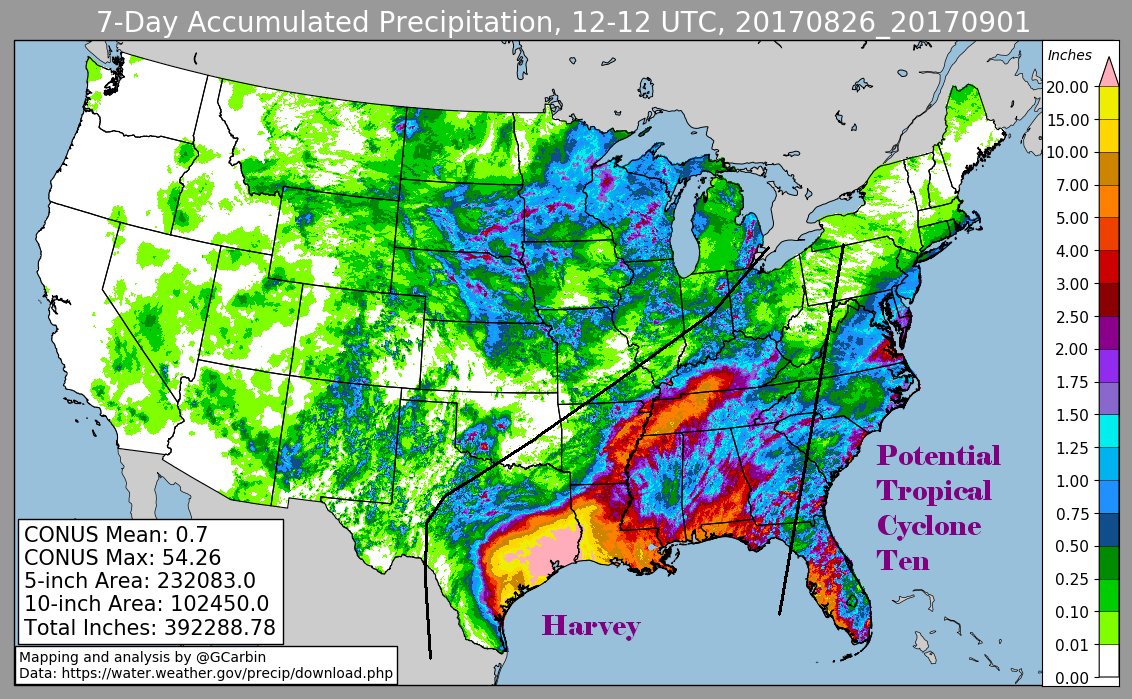
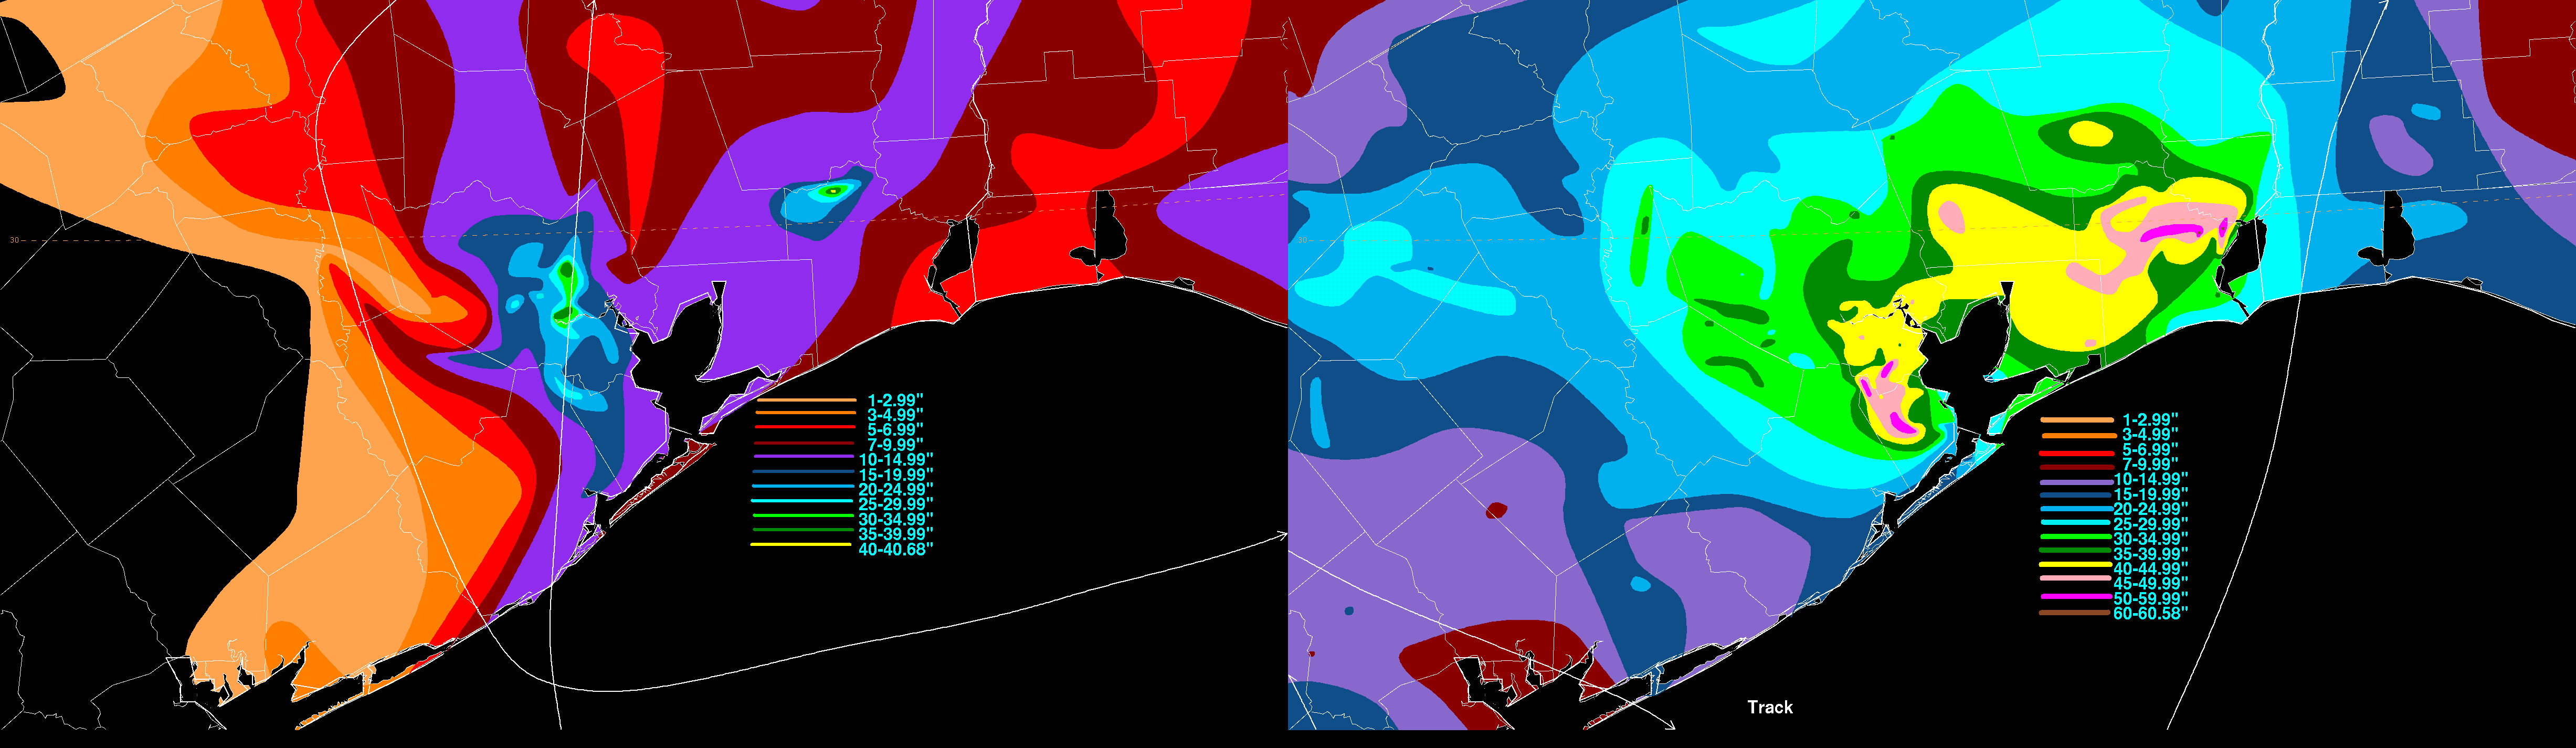
Below are the primary rainfall graphics for Harvey. The first three use rain guage data gathered from the local National
Weather Service forecast offices, CoCoRAHS, Drainage Districts 6 and 7 of Texas, and the Harris County Flood Control Network.
The fourth image uses the official National Weather Service multi-sensor rainfall estimates for this time frame, which
includes radar-derived information.
Harvey is the wettest known storm on a point basis, and likely by volume, within the history of the United States, including
territories and the state of Hawai'i. The resulting floods which occurred near Beaumont and Houston, Texas was
their worst on record. For Beaumont, it more than doubled their wettest six day period on record previous set during
Tropical Storm Danielle in 1980 (records begin in 1901). For Houston Intercontinental Airport, it doubled their
previous wettest six day rainfall that occurred during Tropical Storm Allison (2001).
|
|
|
|
|

Below are zoom-in sections of the rainfall graphics for Louisiana and Texas
|

|
|
Below are
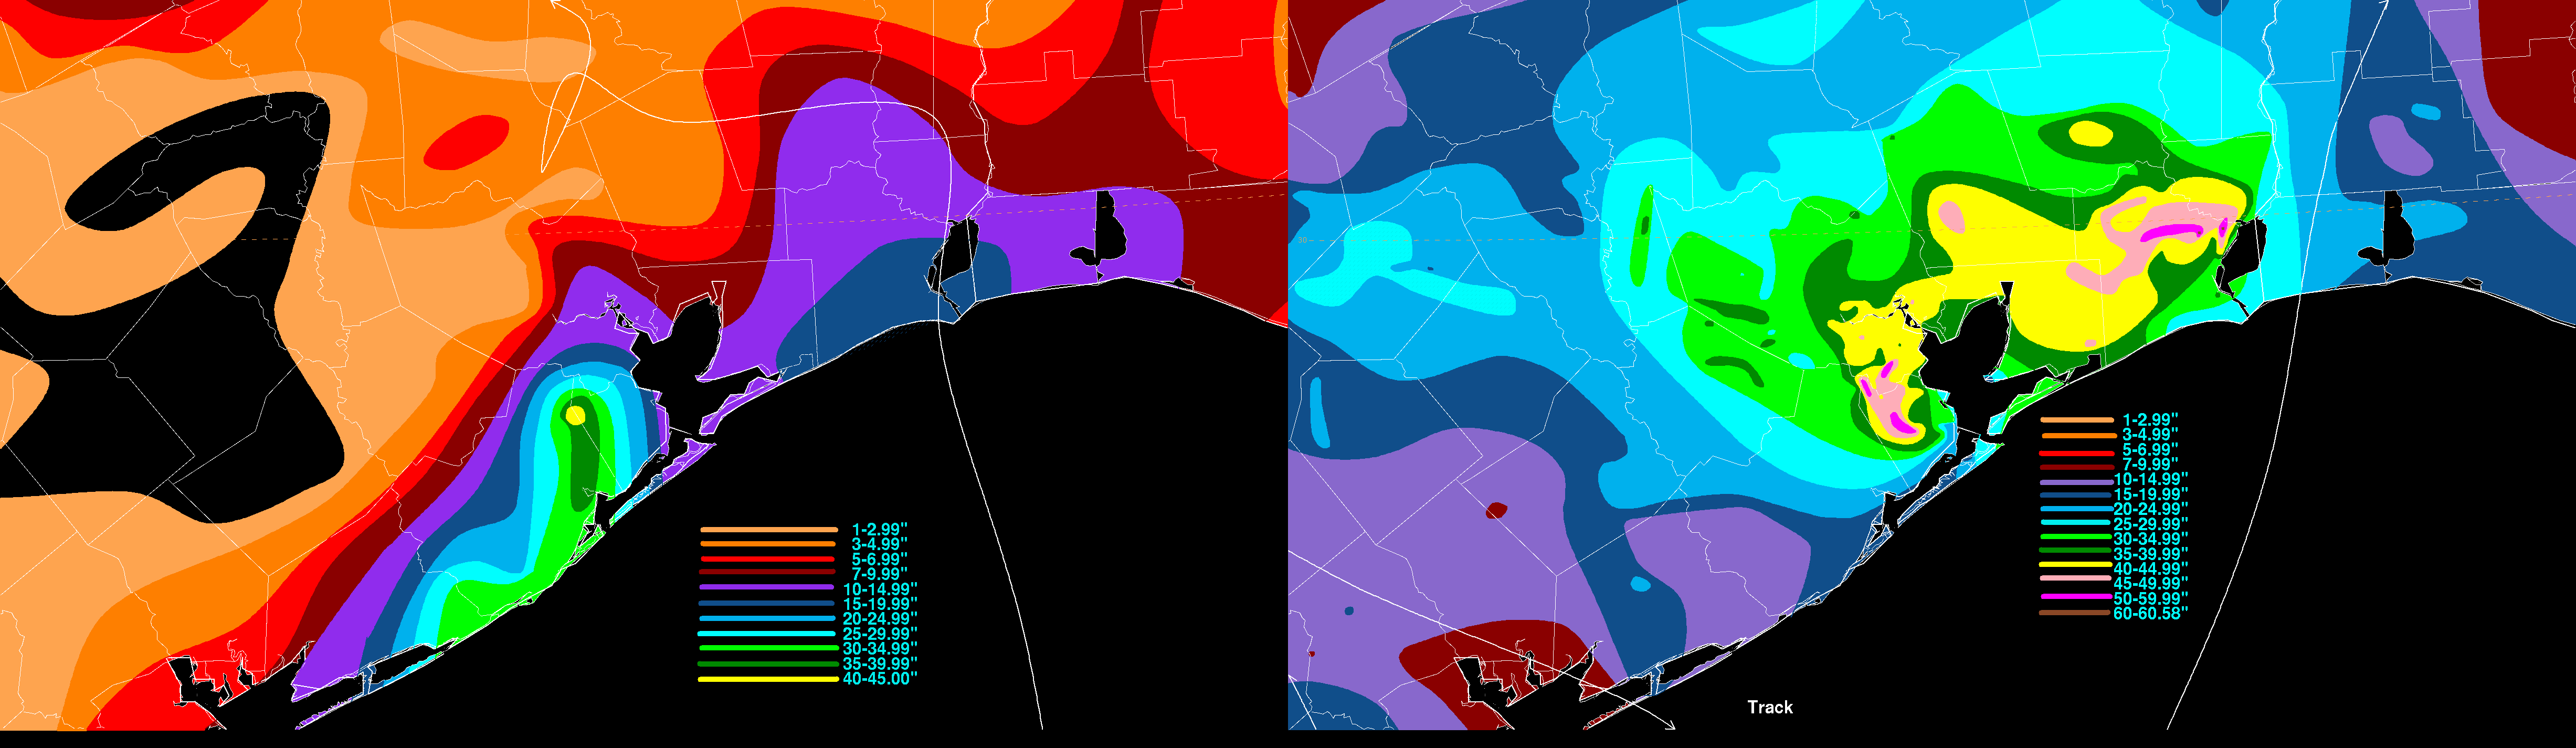
zoom-in sections of the rainfall graphics for Southeast Texas
|
|
|
Below are side-by-side comparisons of Harvey to Allison (2001) and Claudette (1979), the wettest known tropical cyclones in Houston's history.
|
|