An area of low pressure had been anticipated to form in the western Caribbean a week into the future from as early as October 12, which initially
seemed to be assocated with the low-level remnants of Tropical Storm Paula and the tail end of a frontal zone. Over succeeding days, it became
clearer that a tropical wave moving through the tropical Atlantic and a surface trough left behind across the eastern Caribbean from the southern
end of Raphael would be primarily involved in this system's development. On October 20, convection began to organize across the south-central
Caribbean sea with the system moving westward. As it moved into the western Caribbean, a well-defined surface low became associated
with the organizing convection on the 22nd, which led to the classification of Tropical Depression Eighteen. The system dropped southwest,
becoming a tropical storm later in the day. By the 24th, Sandy began to move north-northeast as an eye began to form within its central dense
overcast. Sandy became a hurricane later that day, and crossed the eastern portion of Jamaica.
As it emerged back into the western Caribbean sea, Sandy rapidly developed into a strong category 2 hurricane just prior to landfall in
southeast Cuba. The cyclone was growing in size as it interacted with an upper level low in the Florida Straits. The increasingly hybrid
cyclone of minimal hurricane strength coupled with the upper low as it moved northward, losing central convection for a time. Its central
pressure began to fall due to this baroclinic interaction. As it turned northeast, Sandy reassumed the appearance of a tropical cyclone as
the upper low over the center weakened and a small patch of central convection redeveloped. A closed high across Atlantic Canada combined
with an upper level system dropping to Sandy's west into the Ohio Valley turned Sandy back towards the coast, with the system continuing
to strengthen as it maintained some central thunderstorm activity and an occasional eye feature.
The hurricane-force storm became extratropical as the system interacted with a cold front sweeping around its southern periphery, occluding
just prior to landfall on the 29th. Striking the coast near Atlantic City, New Jersey that evening with a central pressure around 946 hPa,
Sandy broke records for all-time lowest sea level pressure set by the 1993 Storm of the Century at Atlantic City, Philadelphia, and Baltimore,
becoming the strongest known cyclone of any type to strike New Jersey. As the system moved westward near the Mason-Dixon line, Sandy rapidly
weakened. On the 30th, Sandy slowed down and turned northward, with its original surface low degenerating into a surface trough as it became
absorbed by a new low developing in Lake Erie that evening.
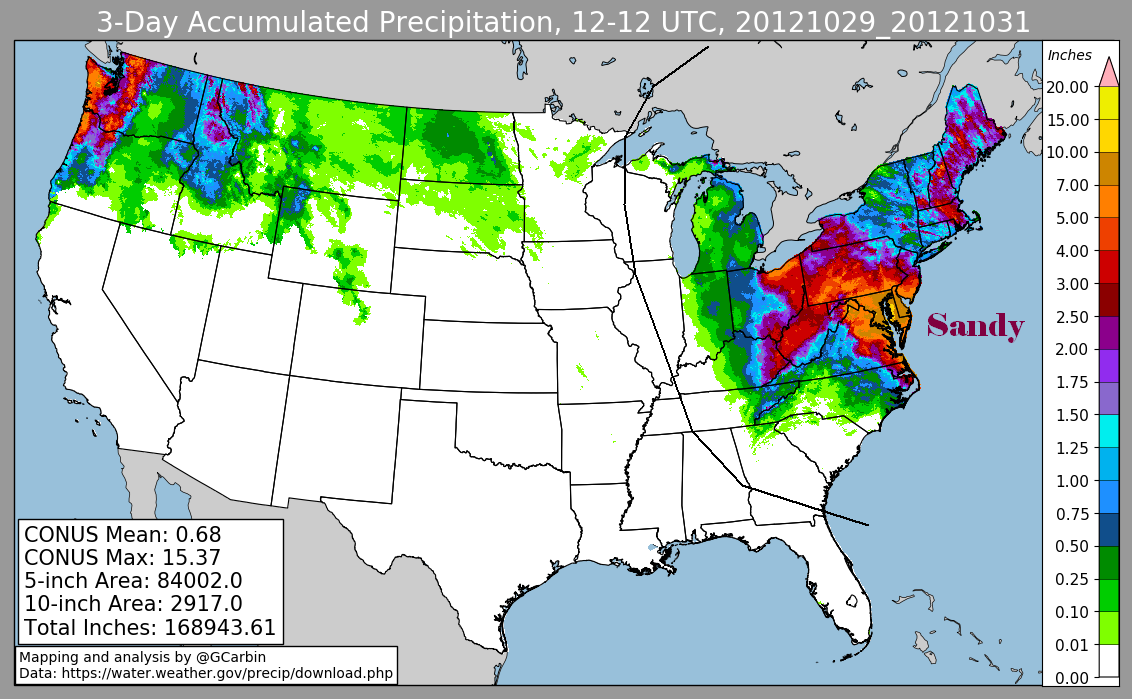
The first three storm total rainfall graphics for Sandy use rain guage data supplied by NWS River Forecast Centers, the CoCoRAHS precipitation
mesonet, as well as post tropical cyclone reports and public information statements from local NWS Forecast Offices. The fourth uses multi-
sensor precipitation estimates, which includes radar-derived information.
 |
 |  |
 |
Below are the storm total snowfall graphics for Sandy, using rain guage data from the CoCoRAHS precipitation mesonet and public information
statements from local NWS Forecast Offices.
 |
 |
 |