Wilma formed from a large area of distubed weather that stretched across much of the Caribbean
Sea during the second week of October. A surface low pressure system gradually became defined
near Jamaica and a tropical depression developed about 215 miles southeast of Grand Cayman
Island on the 15th. The tropical cyclone moved erratically southwestward for two days while slowly
strengthening into a tropical storm.
Wilma became a hurricane and began a west-northwestward motion on the 18th. Later that day,
Wilma began to explosively deepen. On the 19th it became a category 5 hurricane, and its minimum
central pressure dropped to an estimated 882 mb...while its very small eye was centered about 365
miles southeast of Cozumel. This is the lowest pressure on record for a hurricane in the Atlantic
Basin while its maximum sustained reached 175 mph.
On the 20th, Wilma weakened slightly and turned northwest toward the northeast Yucatan
peninsula. On the 21st, the hurricane made landfall over Cozumel, and by early the 22nd
it made landfall over the northeast Yucatan peninsula; both landfalls were at category 4
intensity. Wilma slowly weakened as it drifted over the northeast Yucatan. It finally emerged
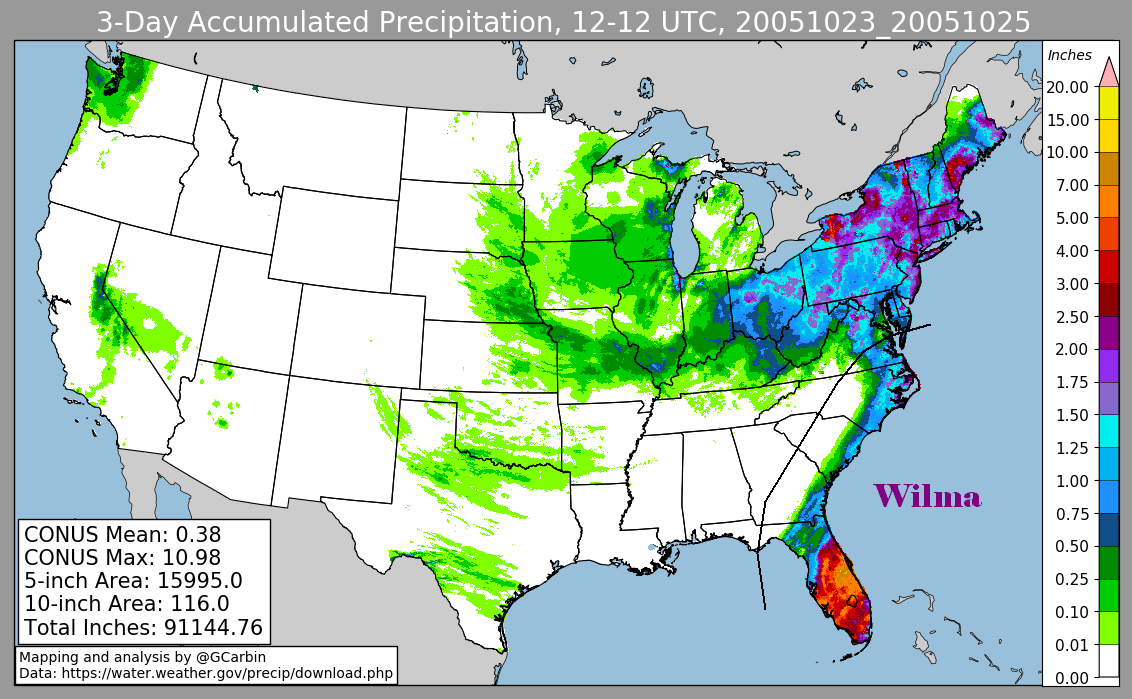
into the Gulf of Mexico early on the 23rd at category 2 intensity. Later that day, it accelerated
northeast towards South Florida. The hurricane restrengthened into a category 3 hurricane
before striking Cape Romano on the 24th. The system crossed Florida in 5 hours...its central
pressure only increased 4 mb and maximum sustained winds barely decreased. The strong
system created widespread wind damage...particularly to roofs and where trees fell into
homes across Deerfield Beach and Boca Raton which stayed in the eyewall the longest.
Soon after moving back out into the Atlantic winds picked back up to category 2 status, but
the pressure kept increasing slightly. The hurricane slowly weakened while it moved rapidly
northeast across the Western Atlantic, eventually losing tropical characteristics about 205
miles south-southeast of Halifax, Nova Scotia on the 25th. Below is its track, provided by
the National Hurricane Center.
The first three storm total rainfall maps below were constructed using rain guage data
provided from NWS River Forecast Centers, as well as additional reports received by
the local forecast offices from their post-tropical cyclone reports. The fourth image
included radar-derived information.
 |
 |
 |
 |
Below is a calendar
showing daily rainfall from this cyclone as of 1200 UTC, or 8 a.m. EDT.
| Sun |
Mon |
Tue |
Wed |
Thu |
Fri |
Sat |
| 22 |
||||||
| 23 |
24 |
25 |