Available Data
| Ensemble | Resolution | Updates Per Day | Membership | Run Length |
|---|---|---|---|---|
| HRRR Time-Lagged Ensemble | ~3 km | 24 | 4 (3 time-lagged) | 15 h |
Additional Details
MODE-Time-Domain (MTD) Info
The Method for Object-Based Diagnostic Evaluation-Time-Domain (MODE-TD) tool from the Model Evaluation Tools v9.0 software developed by the Developmental Testbed Center (DTC) is used to identify and track ensemble member Quantitative Precipitation Forecast (QPF) objects. All HRRR members are tracked at 15-minute intervals using MODE-TD.
MODE-TD is used to identify and track modeled heavy precipitation objects through space and time. MODE-TD initially applies a convolution filter (2 grid spaces) to smooth the data, before masking and removing all data below a specified threshold (e.g. 0.05" in 15 minutes). This simplifies the process of identifying the desired objects by removing small, noisy features. Thereafter, the raw precipitation thresholds are allowed to pass through the previously identified objects, removing the smaller scale "noise." MODE-TD is then run on the retained data to identify modeled objects and their attributes (e.g., centroid location, intensity, orientation, area). The methodology for identifying objects is complex and involves the following two processes illustrated in the figure below:
- 1. Identify coherent space/time objects of a certain size
- 2. Merge nearby space/time objects that are likely the same object
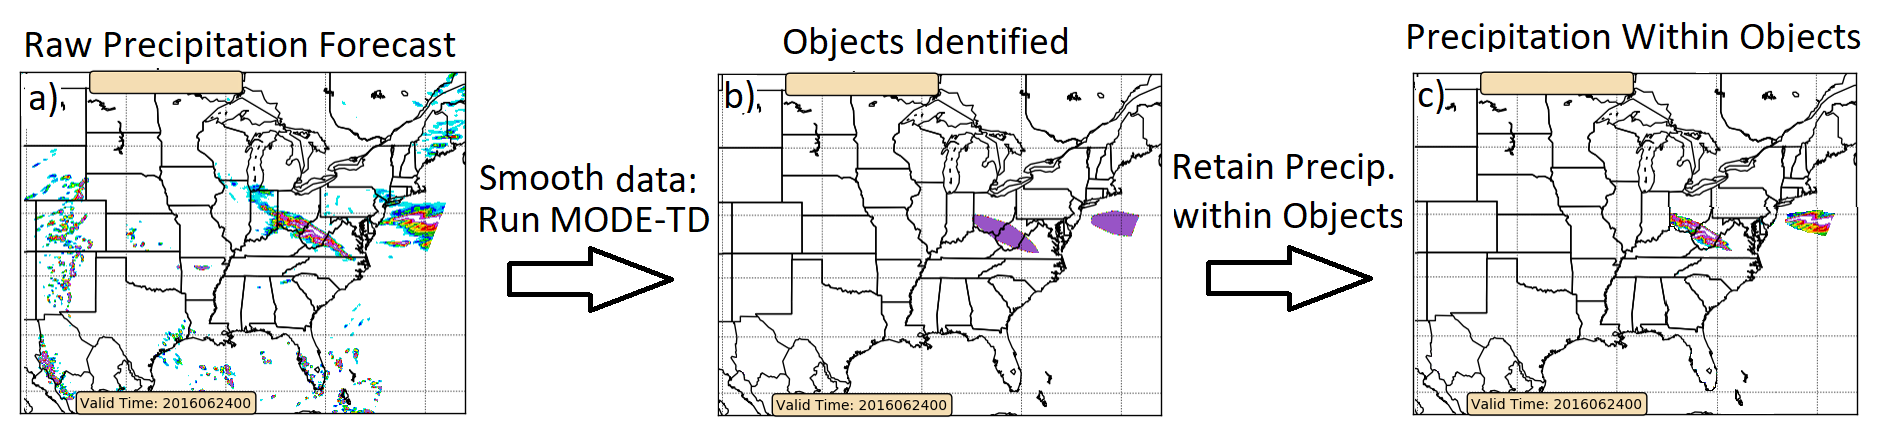
The above figure illustrates an example of this process where raw precipitation is input into MODE-TD in (a), resulting in two identifiable objects in (b), with only the raw QPF within these objects being retained in (c). For more information, please see the DTC description about MODE-TD at https://dtcenter.org/met/users/index.php.
About the Graphics
As discussed above, MODE-TD outputs a variety of object attributes, including object centroid location, velocity, orientation, area, and intensity. Some of these attributes may not informative to operational forecasters. This website displays a subset of MODE-TD output in a quasi-operational setting.
Immediately after the latest HRRR run is complete, MODE-TD is run, and the images are displayed on this site. The most recent HRRR run is usually complete about 1.5 hours after initialization. The lag time between the completion of the most recent HRRR run cycle and the tracking/plotting on this website is approximately one hour, but can take longer on active days. Hence, MODE-TD plots for the 12 UTC HRRR-TLE will usually appear around 14:30 UTC. An example of a MODE-TD ensemble image is shown below.
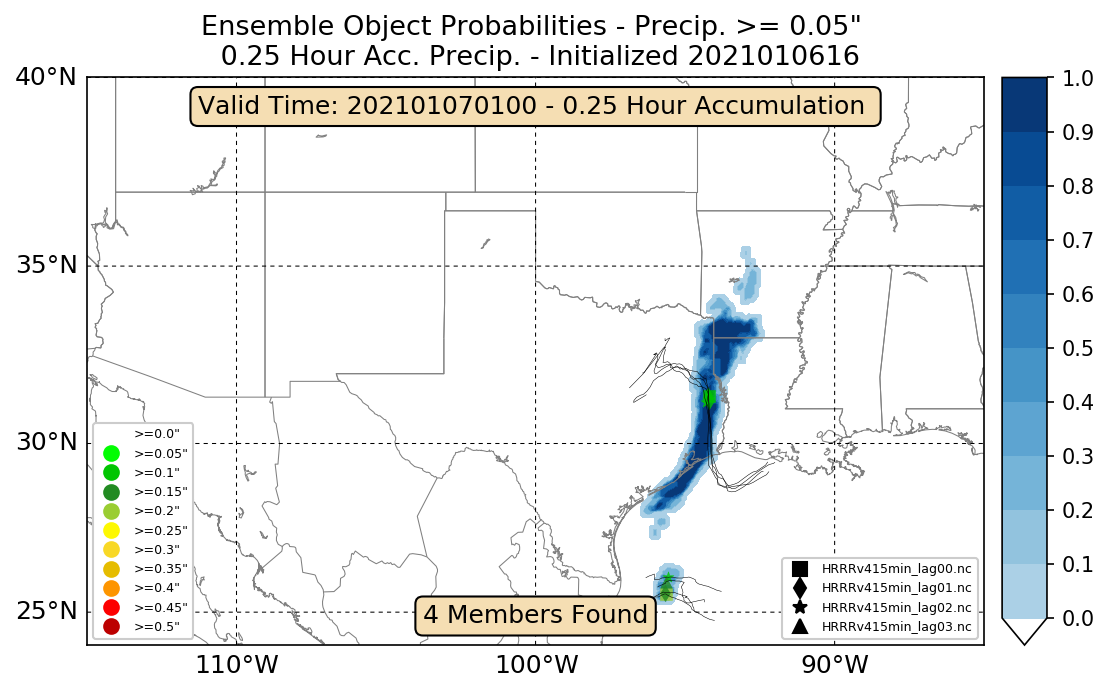
In the figure above, the filled contour is the probability of being in a heavy precipitation object with the corresponding color bar to the right. The location and intensity of the object are denoted for each ensemble by the marker symbol and marker color. The intensity is calculated as the 90th percentile of QPF within each object, with the legend in the bottom left denoting the colorbar. The 90th percentile can be considered a proxy for maximum object intensity experienced by at least a small region inside the object.
These figures display the ensemble spread with respect to placement and intensity. Consider the heavy precipitation object spanning from eastern Texas into Arkansas. There is high confidence on the centroid position in eastern Teaxs, with lower confidence of the object spanning into Arkansas. There is high confidence that this object will produce at least 0.05" rainfall rates in 15 minutes, but no member predicts 15 minute rain rates exceeding 0.15".
About dModel/dt
dModel/dt is a tool to look at the forecast evolution or trends for a particular valid time. This is a function of both how far out a particular model forecast extends and how often a new model cycle is available. For example, when looking at a 1 hour forecast, there will be 15 images available for the current and previous 14 cycles. Note that forecast evolutions can not be shown beyond forecast hour 15. To exit the dModel/dt option, click back on your browser.