Description
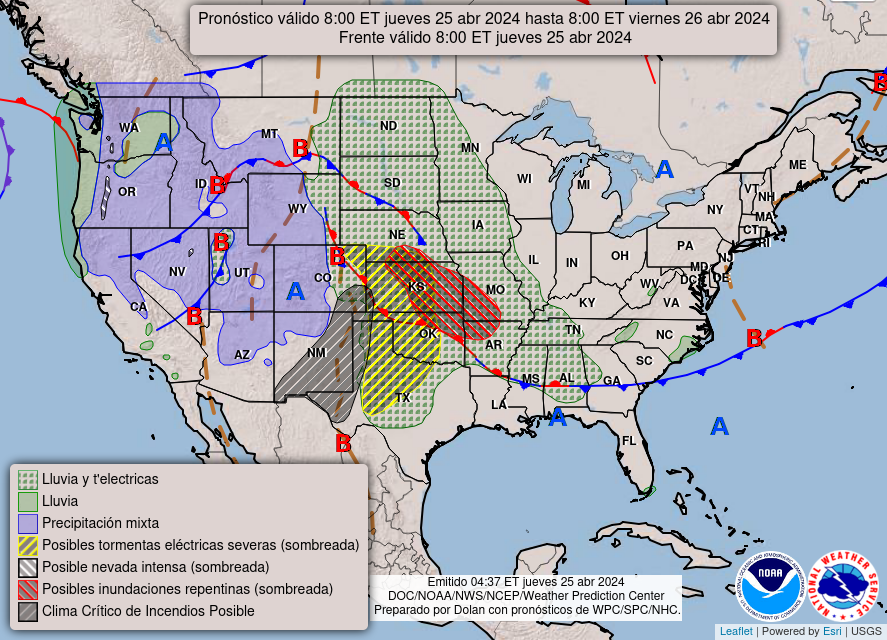
The WPC National Forecast Charts provide an overview of today’s and, during weekdays and on an as-needed basis,
tomorrow’s national weather with an
emphasis on certain hazardous and significant weather. They summarize forecasts from several NCEP
Service Centers including the Storm Prediction Center (for severe thunderstorm and tornado
outlooks), the National Hurricane Center (for tropical storm and hurricane forecasts), and the
Weather Prediction Center (for information concerning heavy rainfall, flooding,
winter weather, and general weather). With overlaid frontal forecasts, these displays serve as a
good overview of the expected weather for the next two days.
The Day 1 (today's) forecast chart is available in both
English and
Spanish. The Day 2 forecast
is currently available only in
English.
Purpose
The charts are intended for use by anyone who needs a non-technical display of the expected
weather including the general public, the media, and the emergency management community. They
show the large-scale weather features and associated significant weather. These charts are
especially useful to travelers or others needing a big picture forecast. They are not intended to provide
detailed local forecasts for any particular area. See
http://weather.gov/ for access to detailed
local NWS forecasts and warnings.
Availability and Product Valid Times
The Day 1 (today's) National Forecast Chart is prepared twice daily at the WPC.
The initial product is issued by 1000 UTC (5 a.m. EST), with an update provided at 2200 UTC (5 p.m. EST).
The Day 2 National Forecast is prepared once daily Monday through Friday and on an as-needed basis during weekends.
This product is issued by 1000 UTC (5 a.m. EST).
Valid times of the features displayed in these products vary depending upon issuance time and the
particular weather phenomenon of interest.
Table 1 below provides detailed information regarding the valid times for these forecasts.
Feature |
Valid Times for Day 1 -
Today's Forecast |
Valid Times for Day 2 -
Tomorrow's Forecast |
| Surface features such as highs, lows, and fronts |
AM issuance: 1200 UTC (7 a.m. EST) |
AM issuance: 1200 UTC (7 a.m. EST) |
| PM issuance: 0000 UTC (7 p.m. EST) |
General precipitation areas |
AM issuance: 24-hour period starting at 1200 UTC (7 a.m. EST) of the current day. |
AM issuance: 24-hour period starting at 1200 UTC (7 a.m. EST) tomorrow. |
| PM issuance: 12-hour period from 0000 UTC to 1200 UTC (7 p.m.-7 a.m. EST) |
Severe weather |
AM issuance: 24-hour period starting at 1200 UTC (7 a.m. EST) of the current day. |
AM issuance: 24-hour period starting at 1200 UTC (7 a.m. EST) tomorrow. |
| PM issuance: 16-hour period starting at 2000 UTC (3 p.m. EST) of the current day. |
| Winter weather forecasts |
AM issuance: 24-hour period starting at 1200 UTC (7 a.m. EST) of the current day. |
AM issuance: 24-hour period starting at 1200 UTC (7 a.m. EST) tomorrow. |
| PM issuance: 24-hour period starting at 0000 UTC (7 p.m. EST) of the current day. |
| Flash flooding forecasts |
AM issuance: From issuance time through 1200 UTC (7 a.m. EST) tomorrow (~27-30 hour period). |
AM issuance: 24-hour period starting at 1200 UTC (7 a.m. EST) tomorrow. |
| PM issuance: From issuance time through 0000 UTC (7 p.m. EST tomorrow) (~27-30 hour period). |
Table 1. Valid times for various features shown on the National Forecast Charts.
Basis of the National Forecast Charts
The National Forecast Charts depict the location of frontal systems and pressure centers over the
continental United States and include several weather parameters derived from forecast charts
prepared by other NCEP Service Centers. See Table 2 for the sources of the forecasts.
Table 2. Sources of forecasts depicted on the National Forecast Charts.
See
/html/fntcodes2.shtml
for an explanation of the symbols used to depict frontal systems on the National Forecast Charts
and WPC surface charts.
Feedback
We are always seeking to improve our products based on user feedback. Comments concerning
this and other WPC products can be sent through the “Contact Us” section of the WPC webpage
at /mail_webmaster.