|
Uncertainty in the initial conditions. |
|
HPC routinely prepares a model diagnostic discussion twice a day using the 0000 and 1200 UTC model runs. The discussion can be found at #http://www.hpc.ncep.noaa.gov/discussions/pmdhmd.html. As part of the PMDHMD forecasters routinely compare the surface, 500-hPA and 250-hPa analyses of the pressures, geopotential height fields and winds to conventional upper air, aircraft observations and also overlay these fields over satellite imagery from the same time. Essentially, the forecasters compare the 00 hr forecast from the model to the observations. They then note any significant differences between the 00h forecast (f00) and the observations. |

|
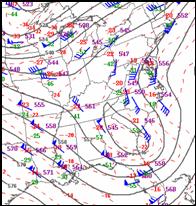
The figure shown above is an example where the model f00 differed significantly from the observations. The model did not catch the surface low that had a central pressure of below 1010 hPa well to the southwest of where it erroneously depicted one. Also note that the satellite cloud pattern supports the missed low and not the erroneous low to the north. This is the type of difference that is worth noting. |
|
Missed surface low |

|
Erroneous low, pressures are 10-hPa lower than observed. |
|
There are several problems inherent in trying to assess how well a model has initialized its forecasts. One is trying to determine how big a difference between the observed geopotential height or pressure difference and f00 is significant. A 2 or 3 hPa difference between the observed value and f00 near the center of a developing surface low may not always be significant as models need maintain vertical consistency between different types of data. Forcing the model to closely “draw for” observed wind or geopotential heights can actual lead to a degradation of the forecast by introducing spurious waves. Also, it is becoming increasingly difficult to judge the f00 as 99% of observations now come from satellites, mostly in the form of radiance data. There is no easy way to compare the radiance values from the imagery to the f00. |
|
Forecasters may note that the f00 from one of the two operational models looks “better” than the f00 (analysis) of the other model. One might therefore assume that the model that appears to have the seemingly more accurate f00 might end up with a better forecast of the synoptic features. In cases where there are obvious differences of the timing or strength of the system this might sometimes be true. However, this assumes that the meteorologist can then anticipate the non-linear evolution of the pattern given the initial differences, this may not always be true. Also, the seemingly more accurate f00 may not always lead to a more accurate forecast. |
|
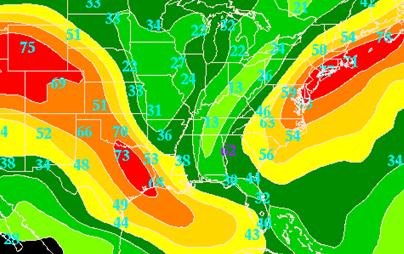
1200 UTC 24 Jan 2000 model initial analysis (f00) of 250-hPa wind speed (color fill, scale at right, in ms-1) and observed wind speeds from RAOBS (numbers) |
|
The poster child for poor initial conditions leading to a major forecast bust is the Jan 25-26 east coast snow storm. The Peach Tree City observation was 62ms-1 compared to the f00 of around 30ms-1at 250-hPa. The large difference between the observation and the model first guess field caused the observation to be tossed out during the quality control process. |
|
Missed observation |
|
While the poor f00 of the wind field probably contributed to the poor model forecast. Modeling experiments (Zhang et 2002) conducted on the case in which individual sounding were withheld from the control analysis suggest that deficiencies in the initial conditions and subsequent poor forecasts of the snow storm were unlikely to have arisen from one or two crucial sounding being missed. The large mesoscale error growth probably was also a result of moist processes.
The results of the Zhang research is to suggest that it will often be difficult to choose a model based simply on differences between observations and the observed state as mesoscale error growth may be strongly dependent on model physics and the various parameterization scheme that are used by the models. The optimal approach to determining the possible impact of initial conditions on model forecasts is therefore an ensemble approach which perturbs both the initial conditions and various types of parameterization schemes. |
|
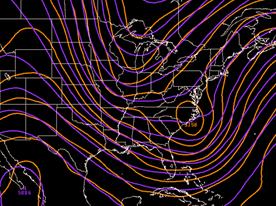
36 hr forecast of the 500-hPa geopotential heights valid at 1200 UTC 25 Jan 2000 (purple) and the observed for the same time (orange) |
|
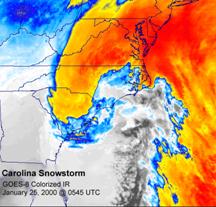
Infrared satellite imagery valid 06 UTC 25 Jan 2000 |
|
The operational models completely missed the development of the closed 500-Hpa low and the precipitation associated with it. Note that the weak shortwave off the coast on the forecast versus the closed low that was observed. The eta forecast its precipitation off the coast at 1200 UTC 25 January and instead the storm produced heavy snow from Raleigh, NC to Washington, DC |

|
Model Trends and predictability |
|
Forecasters have often used the trends of models as a forecast tool. The supposition is that if the model is trending in one direction that the model is most likely to continue to trend in that direction. While this supposition may sometimes prove true, Hamill demonstrated that D(prog)/dt or model trends of 850-hPa forecasts showed no predictive skill. He also noted that there was only a small amount of information on the accuracy of forecasts from the differences between the lagged forecasts. |

|
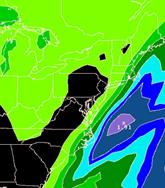
There are times, however, when model trends may be used. The three precipitation forecasts below are from three successive runs of the NAM. By themselves, the only conclusion a forecaster can make about the forecast situation is there is probably uncertainty in where the western edge of the precipitation shield and axis of heavy precipitation will end up. One of the exceptions for short term forecasts is when observations are suggesting that there are significant problems with the current model’s mass and wind field. |
|
12-36 hr ETA QPF valid 1200 UTC 25 Jan 2000 |
|
00-24 hr ETA QPF valid 1200 UTC 25 Jan 2000 |
|
00-24 hr ETA QPF valid 1800 UTC 25 Jan 2000 |
|
Between 1800 UTC 24 Jan. and 0000 UTC 25 Jan., the largest pressure fall of almost 5 hPa occurred along the North Carolina. The pressure fall to the northeast of the developing low were half that. Also, The model forecast winds at 500-hPa near Wilmington, NC (ILM) were southwesterly at around 50 kts while the observed winds were south-southeasterly at 40 kts. The 90o difference in 500 wind direction has huge implications about the western edge of the precipitation field and suggests moisture would be pulled west of the forecast. The location of the pressure falls suggested that the low would track west of the eta track.
The other exception is when the majority of the ensemble guidance and other operational models are predicting the same trend. However, the agreement of the models does not mean that your deterministic forecast based on the consensus of model solution will be the correct one. It only means that the new solution is probably more likely than the old one.
Usually, big model flip flops are not due to marked changes in the initial conditions from what is expected but instead is related to the predictability of the pattern.
|


|
-4 |
|
-3 |
|
500-hPA analysis valid 0000 UTC 25 Jan 2000 |
|
MSL surface analysis at 0000 UTC 25 Jan 2000, pressure fall greater than 4 hPa outlined in red , area of falls greater than 3 is outlined in orange. |