|
Using the various ensemble mean forecasts also can provide valuable clues to the forecast. An ensemble mean typically will not depict small areas with very high values as the ensemble averages all the members. Therefore, an ensemble mean qpf will rarely depict over 2 inches or rain in a 24 hour period. However, the mean can forecast the axis of the maximum rainfall providing the individual members are not biased. The beauty of ensemble means is that they tend to keep your axis between the extreme solution which minimizes your losses. |
|
Ensemble mean forecast of standardized anomalies can also be very useful in assessing the probability of an extreme event. Since ensemble mean products tend to smooth fields and lower the maximum values for any fields forecast, the mean tends to only predict high standardized anomalies when the individual members are in strong agreement. Below are the SREF ensemble mean forecasts of PW and the standardized anomaly of the same field for the October 26-27 event. |
|
15-hr SREF ensemble mean forecast of PW (brown, inches) and standardized anomaly of PW (dashed red) valid 1200 UTC 26 Oct. 2006. |
|
27-hr SREF ensemble mean forecast of PW (brown line, in inches) and standardized anomaly of PW (dashed red) valid 0000 UTC 27 Oct. 2006. |
|
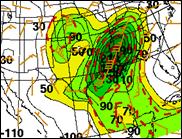
15-hr SREF ensemble mean forecast of 850-hPa magnitude of moisture flux (scale at left, (g/kg)(ms-1), standardized anomaly of magnitude of moisture flux (dashed red) and 850-hPa wind (barbs). |
|
27-hr SREF ensemble mean forecast of 850-hPa magnitude of moisture flux (scale at left, (g/kg)(ms-1), standardized anomaly of magnitude of moisture flux (dashed red) and 850-hPa wind (barbs). |
|
The standardized anomalies, especially of the magnitude of the moisture flux suggested this could be a significant event. Over 99 percent of the time, the observed moisture flux values during the same time of year will be lower than the forecast values. The probability of the 5 inch or greater event forecast by the GFS is therefore probably quite a bit higher than suggested by either the GEFS or SREF guidance which had no 5 inch or greater members. While the standardized anomalies often aid in assessing the probability of a relatively rare heavy rainfall event, the anomalies do not help pinpoint the exact location which are usually focused by mesoscale or even storm scale processes. |
|
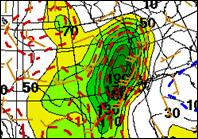
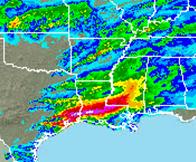
24 hr observed accumulated precipitation valid 1200 UTC 17 Oct 2006. Magenta is over 6 inches, white over 10. |
|
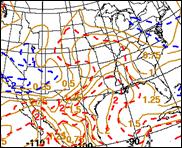
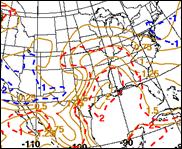
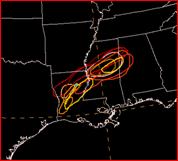
24 hr GEFS member 3-inch contours valid 1200 UTC 17 Oct. 2006. |
|
24 hr SREF member 3-inch contours valid 1200 UTC 17 Oct. 2006. |
|
Using ensemble guidance and standardized anomalies (continued). |
|
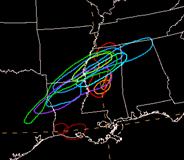
The axis of the observed precipitation maximum was south of any GEFS member. This error highlights one of the shortcomings of using a group of ensemble members that lack sufficient perturbations. The RSM members of the SREF share the same convective scheme with the GFS and all GEFS members. |
|
A 2006 study by Barthold indicated that the location of the GFS rainfall maximum was much more likely to be predicted too far north versus too far south. This is consistent with one of the known biases of the Arakawa Schubert scheme (A/S0 that is mentioned in the UCAR Model Matrix which notes that bulls-eyes from the A/S scheme have their convection form too late and along the sloped frontal surface rather than near to the warm air where the actual convection usually develops earlier than forecast. The SREF ensemble members offered a better idea of the threat area having it extend from southwestern Louisiana into southeastern Arkansas and northern Mississippi. However, its members will often cluster based on their convective schemes with the A/S and Kain-Fritsch members in one group and the Eta members that use the BMJ scheme in another so even the SREF members may not have enough diversity. |