Coordination with state climatologists continues. Until all numbers are validated, values are considered provisional/preliminary.
| State | Low Extreme | Date (Low) | Location (Low) | Related Event | High Extreme | Date (High) | Location (High) |
|---|---|---|---|---|---|---|---|
| Alabama | 943.0 hPa/ 27.85" | Sept. 12, 1979 | Dauphin Island | Hurricane Frederic | 1046.1 hPa/ 30.89" | Feb. 12, 1981 | Huntsville |
| Alaska | 924.8 hPa/ 27.31" | Dec. 31, 2020 | Shemya | 1078.4 hPa/ 31.85" | Jan. 31, 1989 | Northway | |
| Arizona | 981.1 hPa/ 28.97" | Jan. 21, 2010 | Page | 1055.2 hPa/ 31.16" | Dec. 22, 1967 | Winslow | |
| Arkansas | 977.0 hPa/ 28.85" | Feb. 9, 1960 | Fort Smith | 1051.1 hPa/ 31.04" | Jan. 5, 1924 | Fort Smith | |
| California | 973.6 hPa/ 28.75" | Nov. 25, 2019 | Crescent City | 1045.2 hPa/ 30.86" | Jan. 16, 2013 | Alturas | |
| Colorado | 970.4 hPa/ 28.66" | Mar. 13, 2019 | Lamar | 1062.7 hPa/ 31.38" | Jan. 28, 2017 | Gunnison | |
| Connecticut | 948.2 hPa/ 28.00" | Sep. 21, 1938 | Middletown | Long Island Express Hurricane | 1053.8 hPa/ 31.12" | Feb. 13, 1981 | New Haven & Bridgeport |
| Delaware | 954.0 hPa/ 28.17" | Oct. 29, 2012 | Claymont | Post-T.C. Sandy | 1052.2 hPa/ 31.07" | Feb. 13, 1981 | Wilmington |
| District Of Columbia | 968.8 hPa/ 28.61"* | Oct. 29, 2012 | Washington | Post-T.C. Sandy | 1050.1 hPa/31.01"* | Jan. 27, 1927 | Washington |
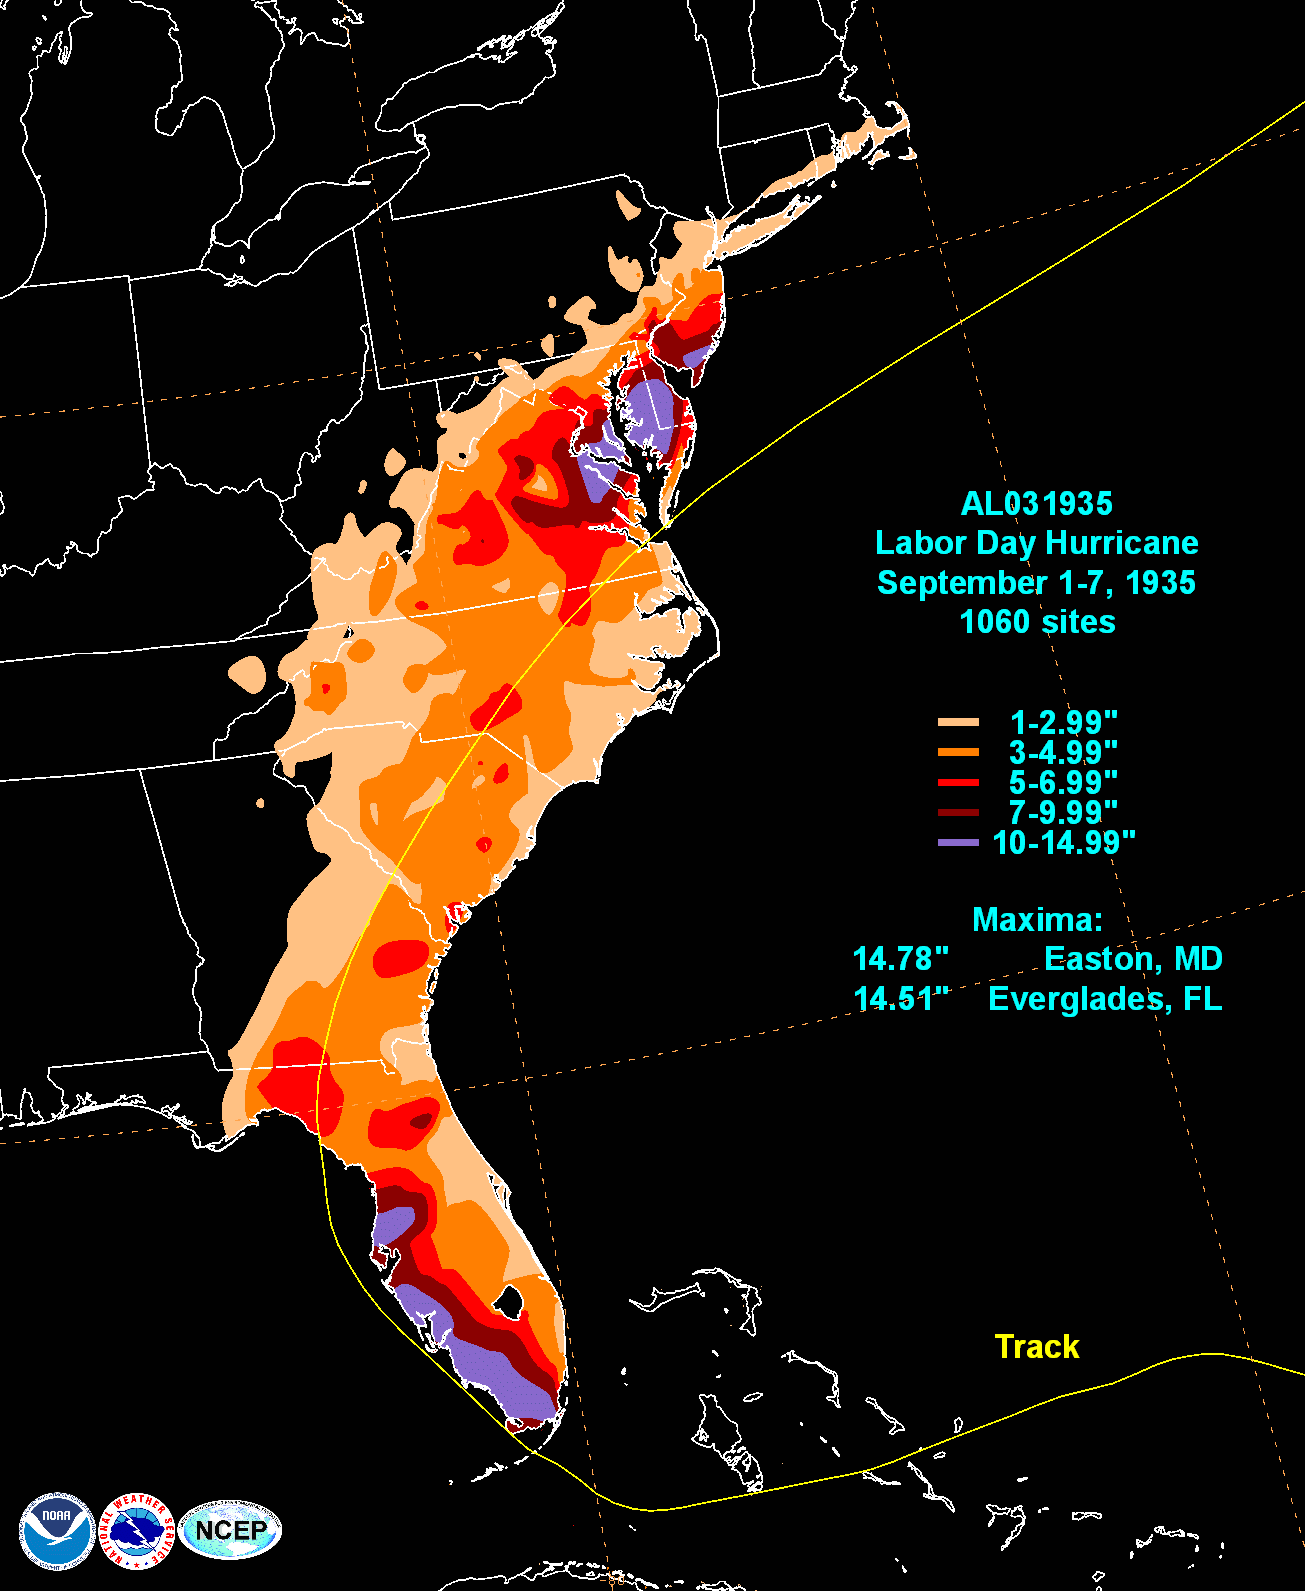
| Florida | 892.0 hPa/ 26.35" | Sep. 2, 1935 | Matacumbe Key | Labor Day Hurricane | 1043.0 hPa/30.80" | Jan. 3, 2008 | Pensacola |
| Georgia | 946.8 hPa/ 27.96" | Sep. 26, 2024 | Quitman | Hurricane Helene | 1045.5 hPa/ 30.87" | Feb. 13, 1981 | Athens |
| Hawai'i | 961.0 hPa/ 28.38" | Sep. 11, 1992 | Kekaha | Hurricane Iniki | 1028.3 hPa/ 30.37" | Apr. 4, 1998 | Hilo |
| Idaho | 979.2 hPa/ 28.92" | Jan. 28, 2008 | Stanley | 1054.2 hPa/ 31.13" | Jan. 21, 1930 Jan. 1, 1979 | Boise Pocatello | |
| Illinois | 971.9 hPa/ 28.70" | Mar. 12, 1923 | Chicago | 1051.0 hPa/ 31.04" | Jan. 7, 1968 | Belleville | |
| Indiana | 974.6 hPa/ 28.78" | Feb. 28, 1902 | Indianapolis | 1049.4 hPa/ 30.99" | Dec. 10, 1919 | Evansville | |
| Iowa | 966.9 hPa/ 28.55" | Nov. 10, 1998 | Spencer | 1055.2 hPa/ 31.16" | Jan. 7, 2015 | Sioux City | |
| Kansas | 971.2 hPa/ 28.68" | Mar. 13, 1973 | Goodland | 1056.0 hPa/ 31.18" | Dec. 24, 1983 | Russell | |
| Kentucky | 975.6 hPa/ 28.81"** | Jan. 26, 1978 | Hebron/Covington | Cleveland Superbomb | 1049.1 hPa/ 30.98" | Feb. 12, 1981 | Louisville |
| Louisiana | 920.0 hPa/ 27.17" | Aug. 29, 2005 | Buras | Hurricane Katrina | 1048.1 hPa/ 30.95" | Jan. 10, 1962 | Shreveport |
| Maine | 954.3 hPa/ 28.18" | Dec. 2, 1942 | Caribou | 1054.2 hPa/ 31.13" | Jan. 21, 1949 | Caribou | |
| Maryland | 956.3 hPa/ 28.24" | Oct. 29, 2012 | Chesapeake City | Post-T.C. Sandy | 1052.5 hPa/31.08" | Feb. 13, 1981 | Baltimore |
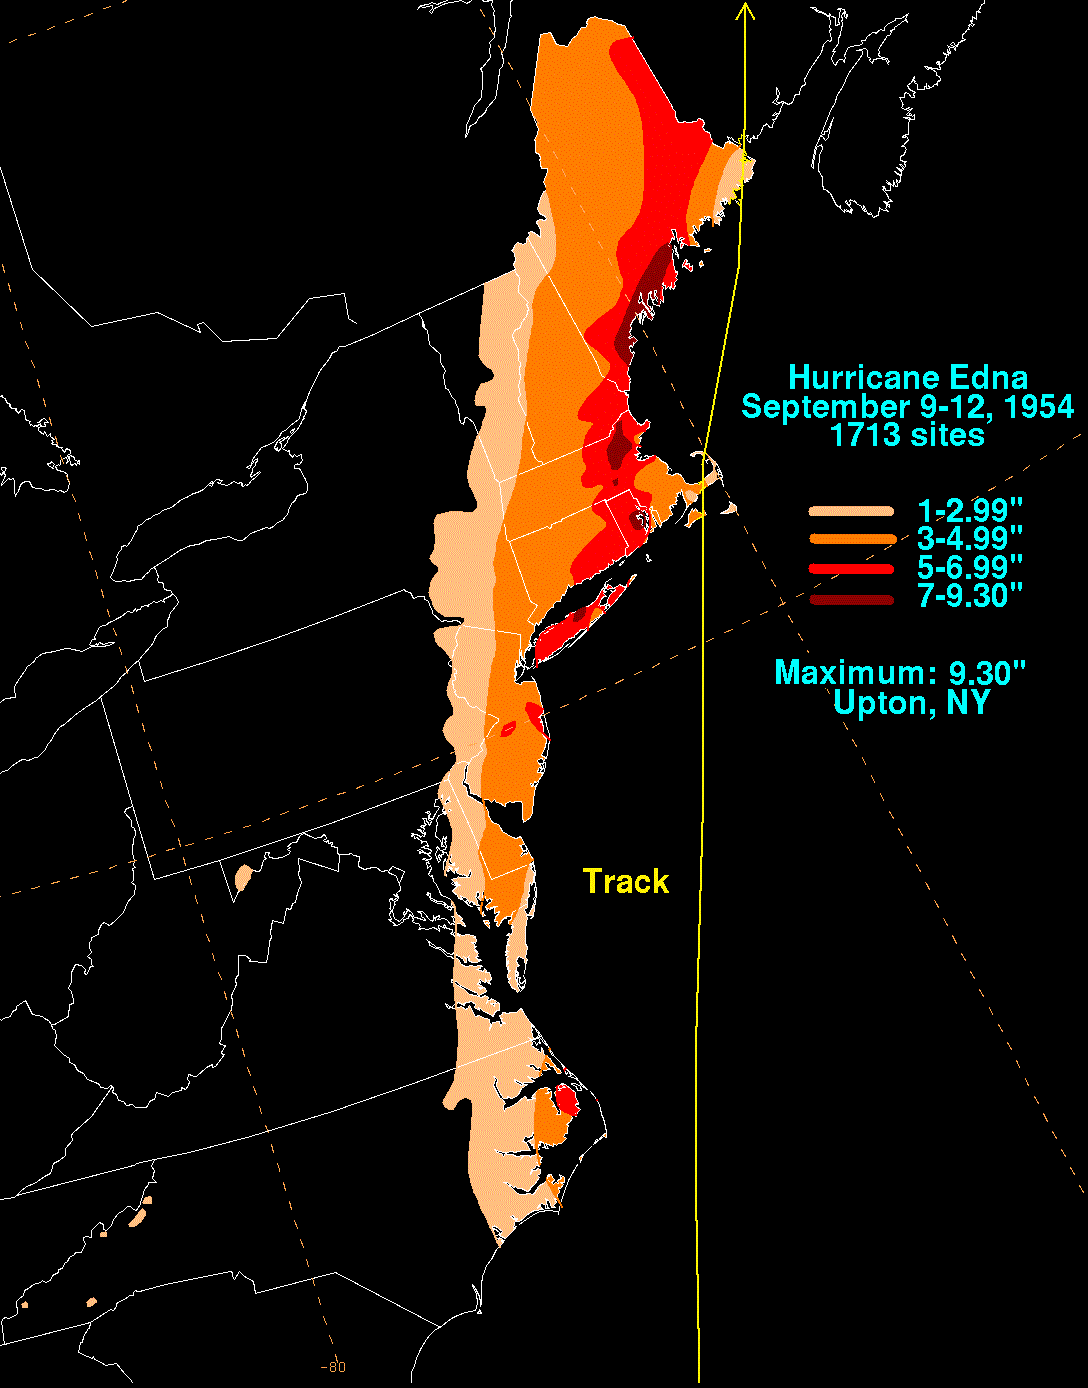
| Massachusetts | 954.3 hPa/ 28.18" | Sep. 11, 1954 | Nantucket | Hurricane Edna | 1052.5 hPa/ 31.08" | Feb. 13, 1981 | Boston Milton |
| Michigan | 956.0 hPa/ 28.23" | Jan. 26, 1978 | Mount Clemens | Cleveland Superbomb | 1054.2 hPa/ 31.13" | Mar. 6, 1948 | Escanaba |
| Minnesota | 955.2 hPa/ 28.21" | Oct. 26, 2010 | Big Fork | 1055.5 hPa/ 31.17" | Feb. 17, 1989 | International Falls | |
| Mississippi | 900 hPa/ 26.58" | Aug. 17, 1969 | Waveland | Hurricane Camille | 1048.1 hPa/ 30.95" | Jan. 6, 1924 | Vicksburg |
| Missouri | 972.9 hPa/ 28.73" | Feb. 27, 1958 | Columbia | 1054.0 hPa/ 31.12" | Jan. 7, 2015 | St. Joseph | |
| Montana | 971.8 hPa/ 28.70" | Sep. 25, 1986 | Miles City | 1063.3 hPa/ 31.40" | Jan. 9, 1962 | Helena | |
| Nebraska | 969.9 hPa/ 28.64" | Mar. 26, 1950 | Grand Island | 1058.2 hPa/ 31.25" | Dec. 24, 1983 | Chadron | |
| Nevada | 978.0 hPa/ 28.88" | Jan. 21, 2010 | Eureka | 1054.2 hPa/ 31.13" | Dec. 9, 1956 | Elko | |
| New Hampshire | 962.5 hPa/ 28.42" | Feb. 2, 1976 | Mount Washington | Groundhog Day Cyclone | 1057.0 hPa/ 31.21" | Mar. 30, 2008 | Mount Washington |
| New Jersey | 945.5 hPa/ 27.92" | Oct. 29, 2012 | Atlantic City Marina | Post-T.C. Sandy | 1052.8 hPa/ 31.09" | Feb. 13, 1981 | Newark |
| New Mexico | 973.4 hPa/ 28.74" | Mar. 13, 2019 | Clayton | 1051.1 hPa/ 31.04" | Jan. 10, 1962 | Roswell | |
| New York | 946.2 hPa/ 27.94" | Sep. 21, 1938 | Bellport | Long Island Express Hurricane | 1053.5 hPa/ 31.11" | Feb. 13, 1981 | Albany |
| North Carolina | 947.1 hPa/ 27.97" | Sep. 14, 1944 | Cape Hatteras | Great Atlantic Hurricane | 1050.1 hPa/ 31.01" | Feb. 13, 1981 | Greensboro |
| North Dakota | 964.4 hPa/ 28.48" | Oct. 26, 2010 | Grand Forks | 1060.3 hPa/ 31.31" | Dec. 24, 1983 | Williston | |
| Ohio | 957.7 hPa/ 28.28" | Jan. 26, 1978 | Cleveland | Cleveland Superbomb | 1051.2 hPa/ 31.04" | Jan. 26, 1927 | Toledo |
| Oklahoma | 972.2 hPa/ 28.71" | Feb. 9, 1960 | Enid | 1054.5 hPa/ 31.14" | Dec. 24, 1983 | Enid | |
| Oregon | 966.1 hPa/ 28.53" | Dec. 12, 1995 | Astoria | Hannukah Storm | 1054.5 hPa/ 31.14" | Jan. 1, 1979 | Baker City |
| Pennsylvania | 951.9 hPa/ 28.11" | Oct. 29, 2012 | Marcus Hook | Post-T.C. Sandy | 1053.2 hPa/ 31.10" | Feb. 13, 1981 | Williamsport Philadelphia |
| Puerto Rico | 926.6 hPa/ 27.36" | Sep. 20, 2017 | Yabucoa | Hurricane Maria | 1025.1 hPa/ 30.27" | Jan. 27, 1957 Feb. 2, 1953 | San Juan |
| Rhode Island | 955.0 hPa/ 28.20" | Mar. 7, 1932 | Block Island | 1052.5 hPa/ 31.08" | Feb. 13, 1981 | Providence | |
| South Carolina | 933.0 hPa/ 27.55" | Sep. 22, 1989 | Mount Pleasant | Hurricane Hugo | 1047.6 hPa/ 30.935" | Feb. 13, 1981 | Greer |
| South Dakota | 969.5 hPa/ 28.63" | Mar. 26, 1950 | Sioux Falls | 1056.6 hPa/ 31.20" | Dec. 28, 1917 | Pierre | |
| Tennessee | 973.9 hPa/ 28.76" | Jan. 25, 1978 | Bristol/Tri-Cities | Cleveland Superbomb | 1048.8 hPa/ 30.97" | Jan. 5, 1924 | Nashville |
| Texas | 935.3 hPa/ 27.62" | Sep. 11, 1961 | Port Lavaca | Hurricane Carla | 1053.5 hPa/ 31.11" | Dec. 24, 1989 | Amarillo |
| Utah | 979.6 hPa/ 28.93" | Feb. 22, 2023 | Moab | 1054.2 hPa/ 31.13" | Dec. 8, 1956 | Milford | |
| Vermont | 957.7 hPa/ 28.28" | Jan. 3, 1913 | Burlington | 1053.2 hPa/ 31.10" | Feb. 13, 1981 | Burlington | |
| Virginia | 960.0 hPa/ 28.35" | Mar. 6, 1932 | Norfolk | 1052.7 hPa/ 31.09" | Feb. 13, 1981 | Sterling/Dulles Airport | |
| Washington | 960.9 hPa/ 28.37" | Dec. 12, 1995 | Destruction Island | Hannukah Storm | 1053.2 hPa/ 31.09" | Jan. 1, 1979 | Spokane Walla Walla |
| West Virginia | 964.6 hPa/ 28.48" | Jan. 26, 1978 | Wheeling | Cleveland Superbomb | 1051.6 hPa/ 31.05" | Feb. 13, 1981 | Martinsburg |
| Wisconsin | 961.3 hPa/ 28.39" | Oct. 26, 2010 | Superior | 1053.2 hPa/ 31.10" | Jan. 26, 1927 | Green Bay | |
| Wyoming | 977.0 hPa/ 28.85" | Jan. 12, 1932 | Lander | 1061.2 hPa/ 31.34" | Dec. 24, 1983 | Worland |
* The District of Columbia: Has large gaps in their weather record as Washington National Airport (DCA) was moved into Virginia by an act of Congress in 1945. The D.C. dataset includes observations from the old Weather Bureau castle on M St. NW into the early 1940's, Bolling Air Force Base into the late 1960's, and NOS Site WASD2 along the Potomac River since 2005. This leaves a huge gap which excludes the impact of the March 1993 Storm & the extensive mid-February 1981 anticyclone on its low and high pressure records, respectively.
** Kentucky: No pressure records have been found from far eastern Kentucky for the month of January 1978. The Jackson record starts later. Based upon Parkersburg, West Virginia data and a publication soon after the fact, values as low as the mid to upper 960s hPa would have been possible during the Cleveland Superbomb in northeast Kentucky.