 |
Statistics. On average, a tropical storm, or its remnants, can be expected to impact the Old Dominion yearly, with hurricanes expected once every 2.3 years. These averages are competitive to what is seen down south along the Gulf coast, even though major hurricanes are far more rare.
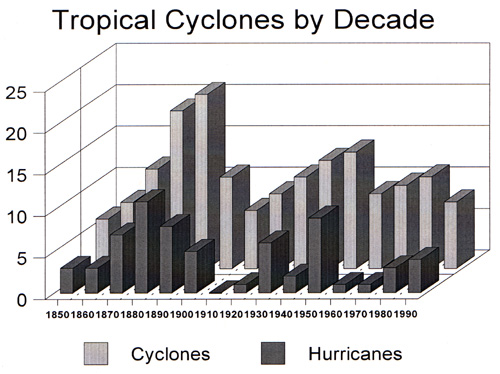
The chart below breaks down the tropical storm
and hurricane distribution by decade starting at 1851...the year the hurricane
database begins for the North Atlantic, Caribbean Sea, and the Gulf of
Mexico. Tropical storms and hurricane categories before 1886 were determined
by damage done across the area. Surprisingly, some of the most active decades
for Virginia were during the "Little Ice Age", a period of global coolness,
that lasted from around 1870 to 1900. One would expect more storms to impact
the state during warmer years than cool years, but this is not the case.
|
From the graph above, there appears to be a fifty
year cycle in the number of tropical storms and hurricanes in and nearby
Virginia. The peak of the cycle tends to last around 15 years.
Movement. In most cases, tropical
cyclones have moved, regardless of the month, from southwest to northeast
across Virginia. There are some examples were storms crossed from east
to west or vice versa, but that is quite uncommon. To the lower right is
a map showing the tracks hurricanes have taken past Virginia Beach during
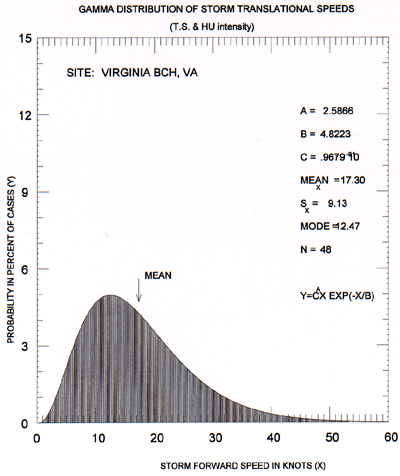
a 111 year period. The mean forward motion of tropical cyclones through
the area is 17.3 knots...or 20 mph. This is normal as tropical cyclones
round the western periphery of the Azores- Bermuda High which dominates
the flow across the Atlantic during summer months. To the lower right
shows the distribution of translational speed past Virginia Beach, courtesy
of the National Hurricane Center.
 |
 |
| Pressure.
The tracks of most tropical
cyclones that have affected Virginia are concentrated near the lower coast. Therefore, the lowest pressures measured from these storms were mainly in the area around Norfolk. Only one category three hurricane is known to have passed near Virginia, thus pressures reported across the state are higher that those you would find along the Gulf or South Atlantic coasts. To the right is a chart showing the ten lowest pressures measured across the state from hurricanes. Note how all the readings are from Donna (1960), Floyd (1999), the Chesapeake-Potomac Hurricane (1933), and Hazel (1954). |
|
|
Winds.
Coastal sections of Virginia get
lashed with sustained winds of hurricane force about every decade. Cape Henry has twelve occurrences while Norfolk has six in the 128-year period ending in 1998. If you include winds of tropical storm force, Cape Henry has reported them 73 years while Norfolk experienced gales 46 years. The anemometer at Cape Henry is higher than at Norfolk, which explains the increased frequency at that site. Friction close to the ground tends to dampen stronger winds from aloft. Below are charts showing maximum winds for Cape Henry and Norfolk. To the left is a listing of wind gusts at or above 100 mph reported statewide. |
 |
 |
 |
 |
 |
 |
Rainfall. The most common effect
of a tropical cyclone passing by Virginia is its associated rainfall. The
heaviest rain in a truly tropical cyclone, outside of terrain effects,
occurs to the east of the track. However, many systems that pass this far
to the north exhibit some non-tropical characteristics, such as cold/dry
air wrapping around the west and south sides of the circulation. When this
happens, the rainfall distribution changes markedly. The maximum rainfall
can then be expected to be just west of the track, and well to the east,
outside the reach of the dry air. Severe weather, such as microbursts,
tornadoes, and hail tend to be more common with this dry air intrusion,
mainly to the east of the track. To the lower right is a chart of
the ten highest rainfall amounts, in the Old Dominion, to be measured in
association with a tropical cyclone.
| Virginia has some special
considerations
that can affect rainfall. Mountains to the west act as a perfect mechanism for upward motion when a sustained east wind is present, and can lead to flash flooding and landslides in that region. Also, as a tropical system approaches from the south, a baroclinic boundary sets up between the moist Atlantic Ocean and the relatively drier landmass to the west. This boundary can set up two or three days in advance of a tropical storm, and can lead up to prolonged heavy rains across coastal sections. As the cyclone advances north, the boundary will slowly shift west, but rarely makes it west of a Richmond/Washington, D.C. line. |
|
 |
Return to Virginia Hurricane History |