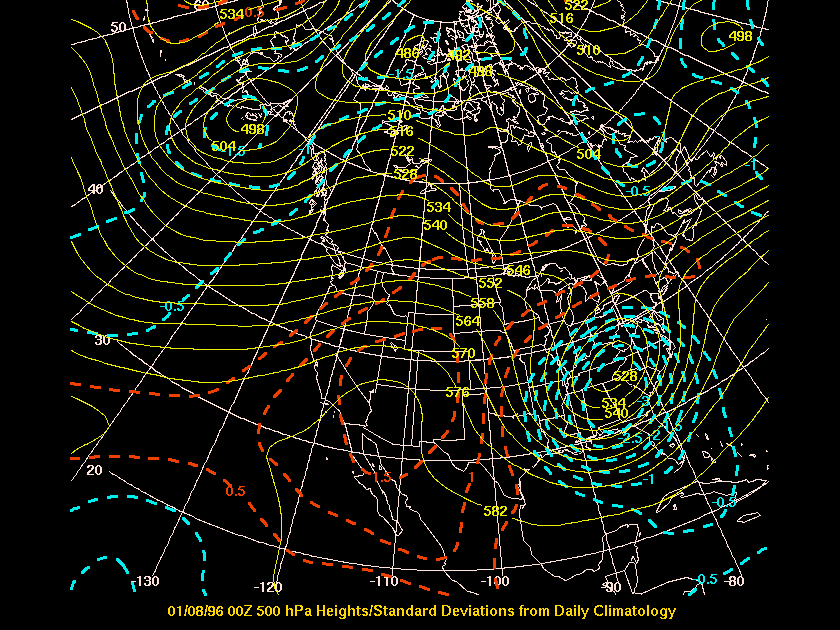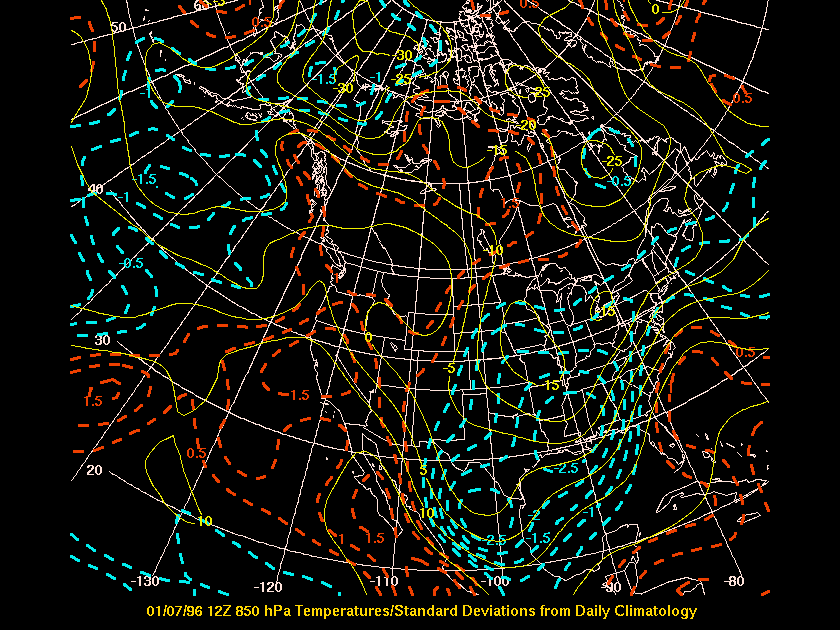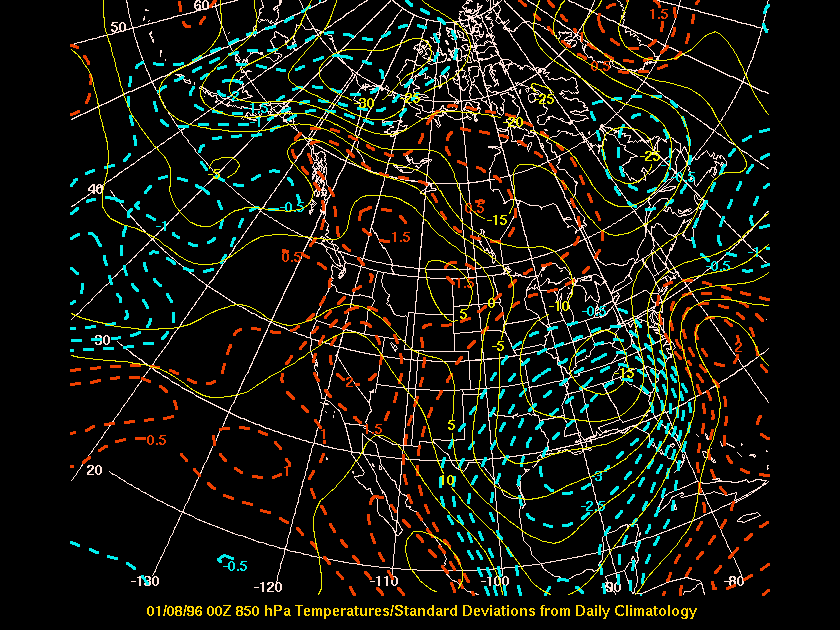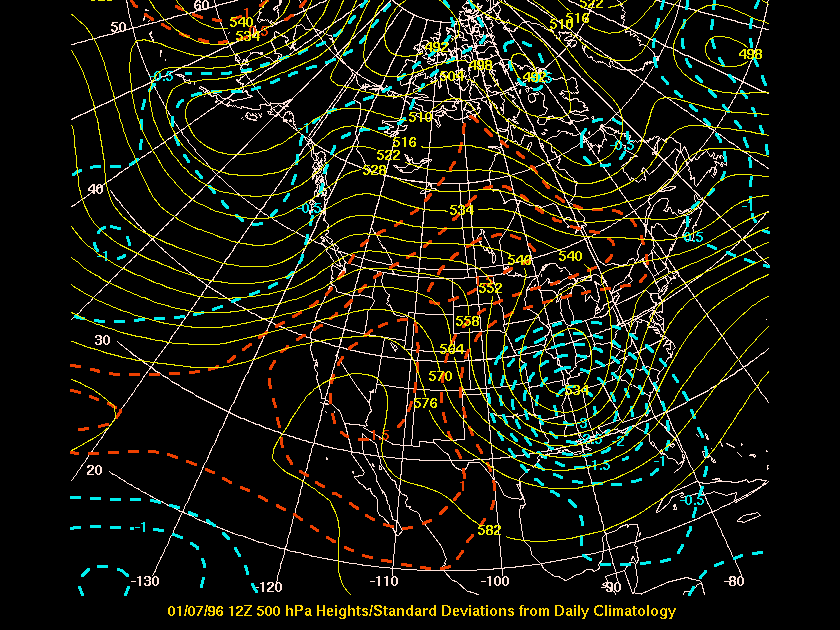
The Blizzard of January 1996 featured a
significant standard deviation form climatology at 500 hPa over the Southeast
U.S. The first two gif images show 500 hPa heights and number of standard
deviations for 12Z January 7 and 00Z January 8. The last two images show
850 hPa temperatures and number of standard deviation from climatology
for the same time stamps. Note the cold/warm coupling along the eastern
seaboard. This is in line with the strong lower tropospheric coastal frontogenesis
which was a key forcing mechanism in the heavy snowfall bands in the Mid
Atlantic region.