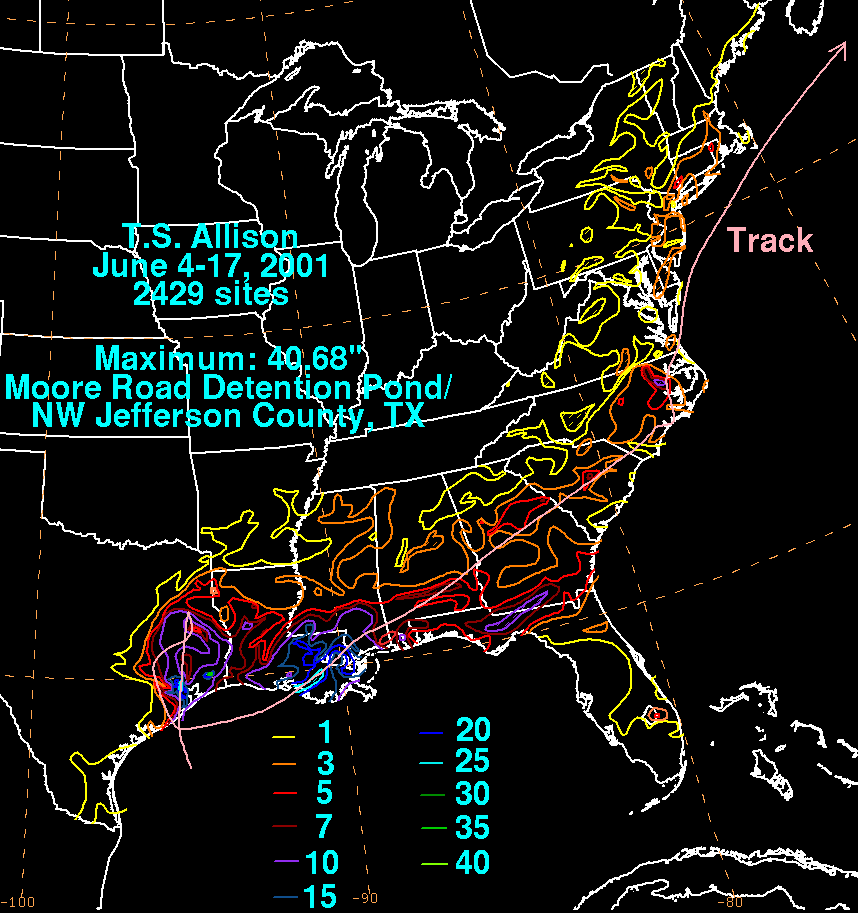
A tropical wave moved
off the west coast
of Africa on May 21st. Tracking westward, it moved
through the tropical Atlantic and Caribbean Sea...reaching the eastern
Pacific Ocean on June 1st.
A low level circulation formed on the 3rd south of Vera Cruz, and this
system moved north into
southeast Mexico steered by deep southwest flow. It emerged into the
Bay of Campeche on the
4th as an area of thunderstorms, and guided north-northwest through
the western Gulf of Mexico.
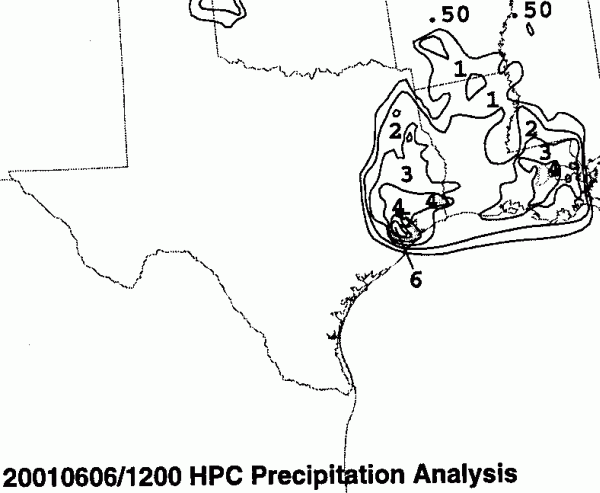
The low became increasingly organized, and when
reconnaisance aircraft
investigated the system
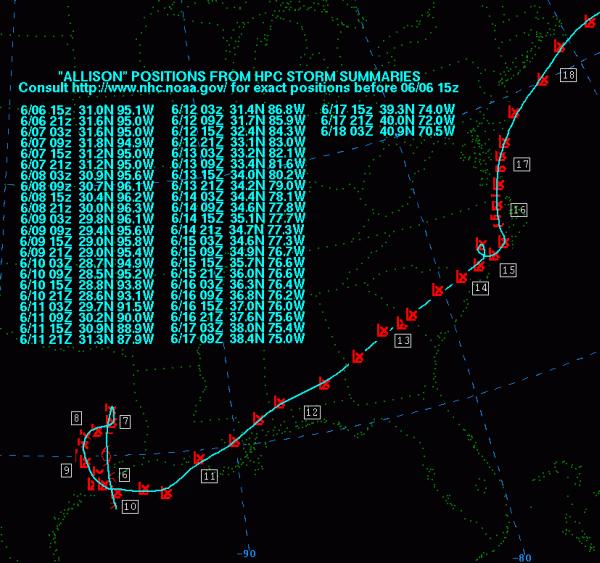
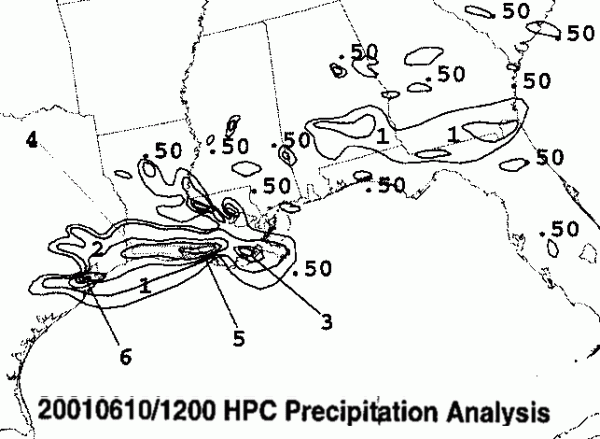
on the 5th, it had already become a tropical storm about 80 miles south
of Galveston Texas. As it
was steered by the subtropical ridge off the southeast, Allison moved
north into Texas that evening,
eventually tracking as far inland as Lufkin by the morning of the
7th.
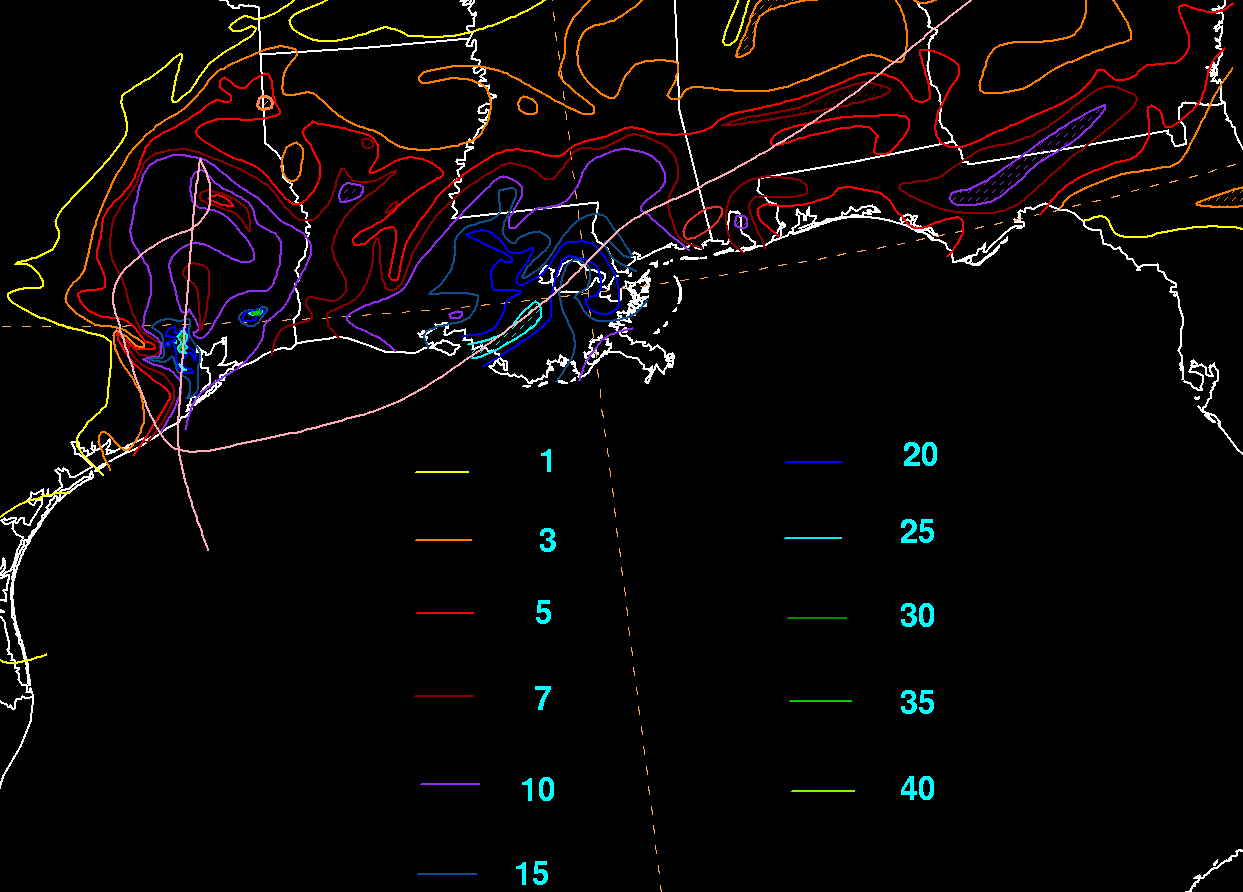
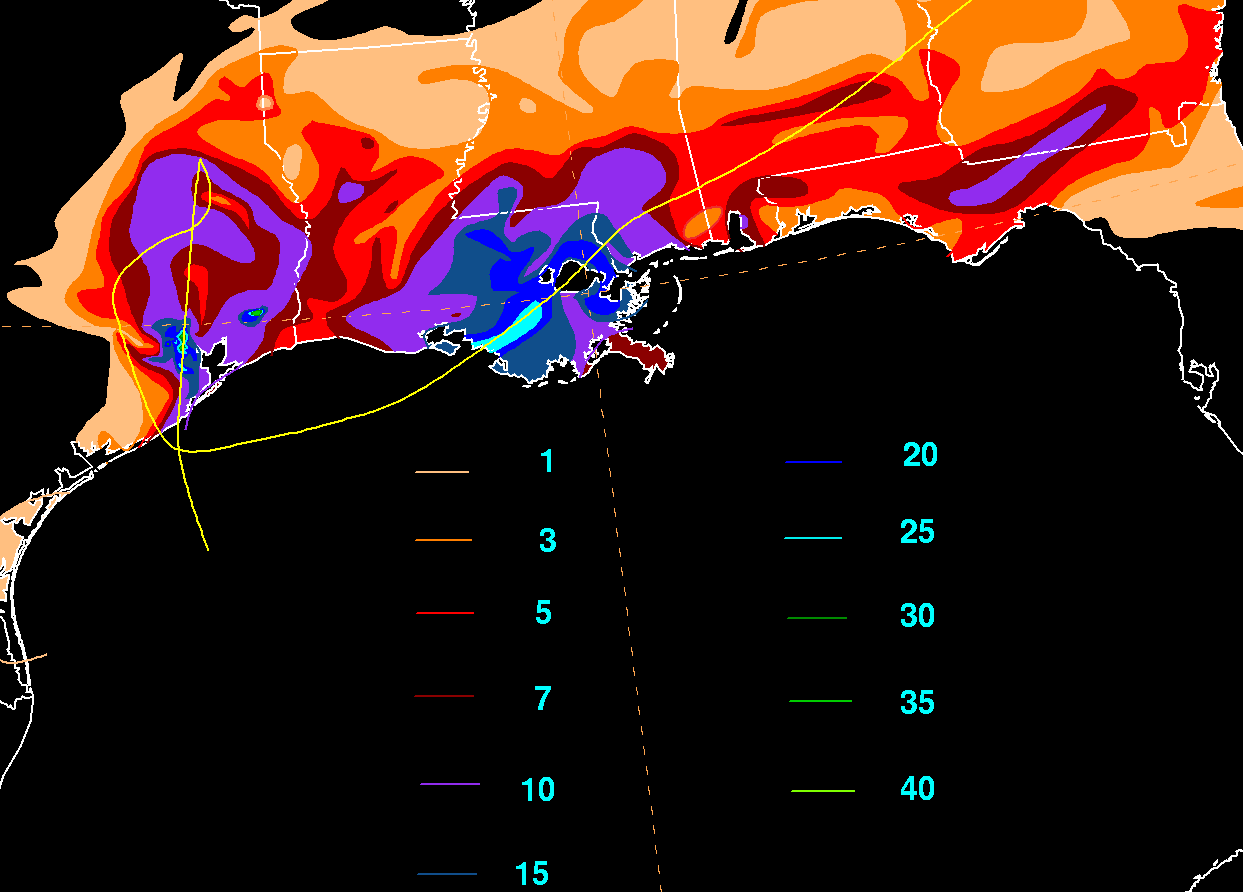
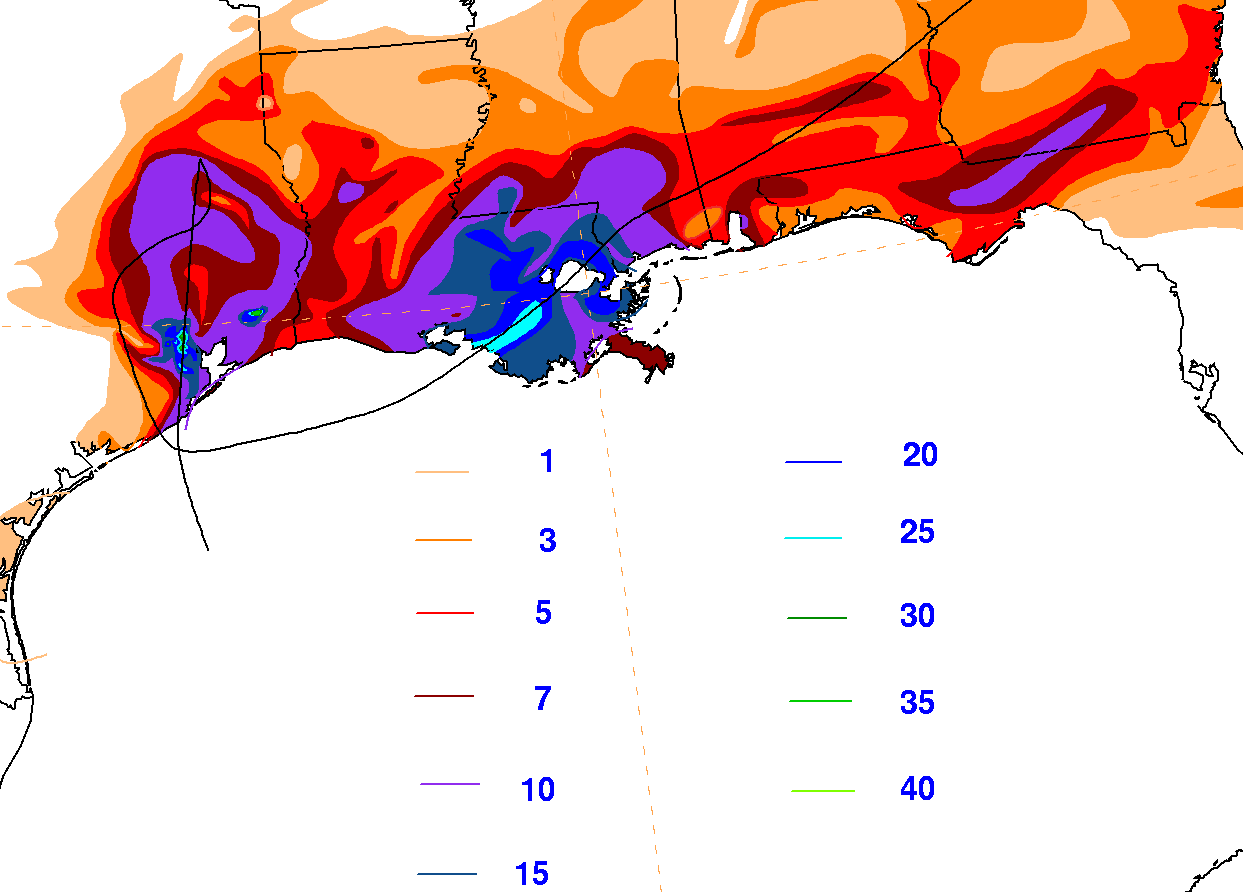
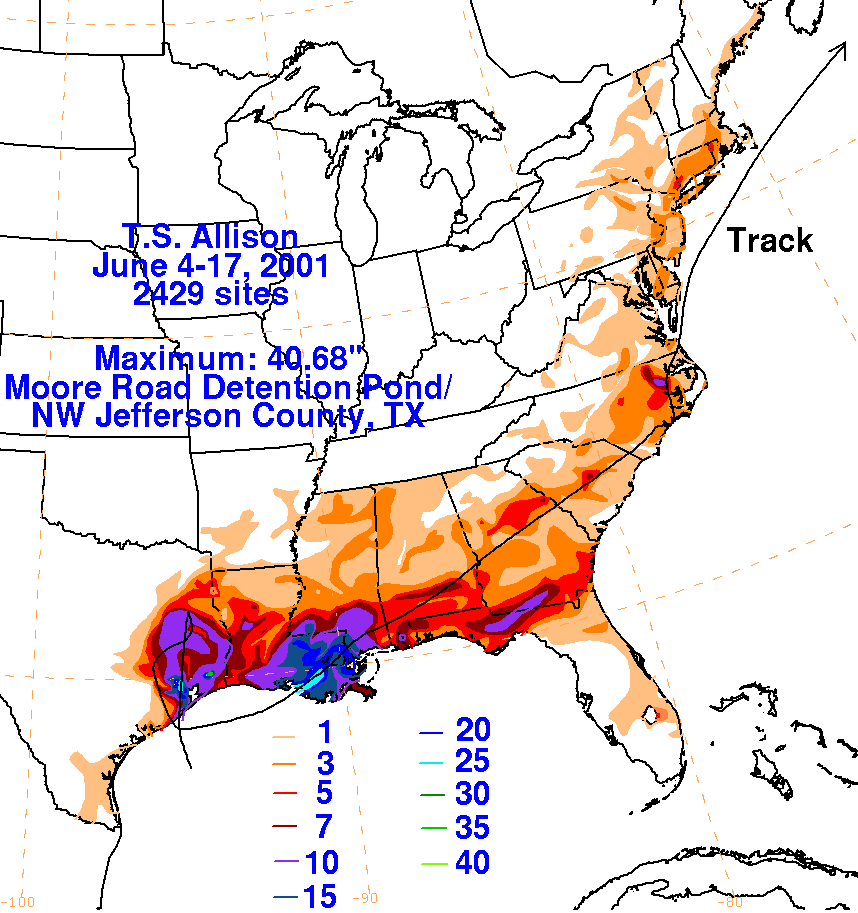
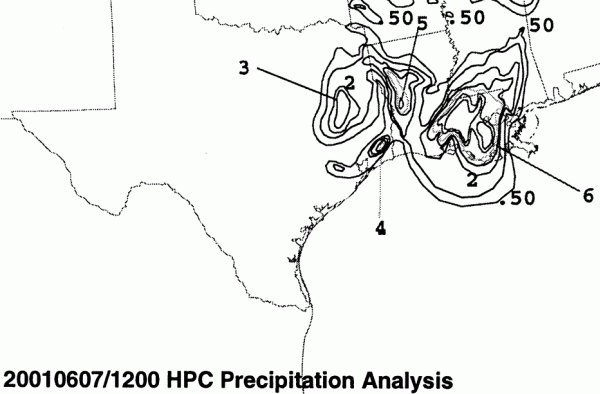
After already dropping ten or
more inches of rain across portions of Texas and Louisiana, the cyclone
began to move southward as
a ridge over New Mexico strengthened just as the high off the southeast
flattened and moved southeast.
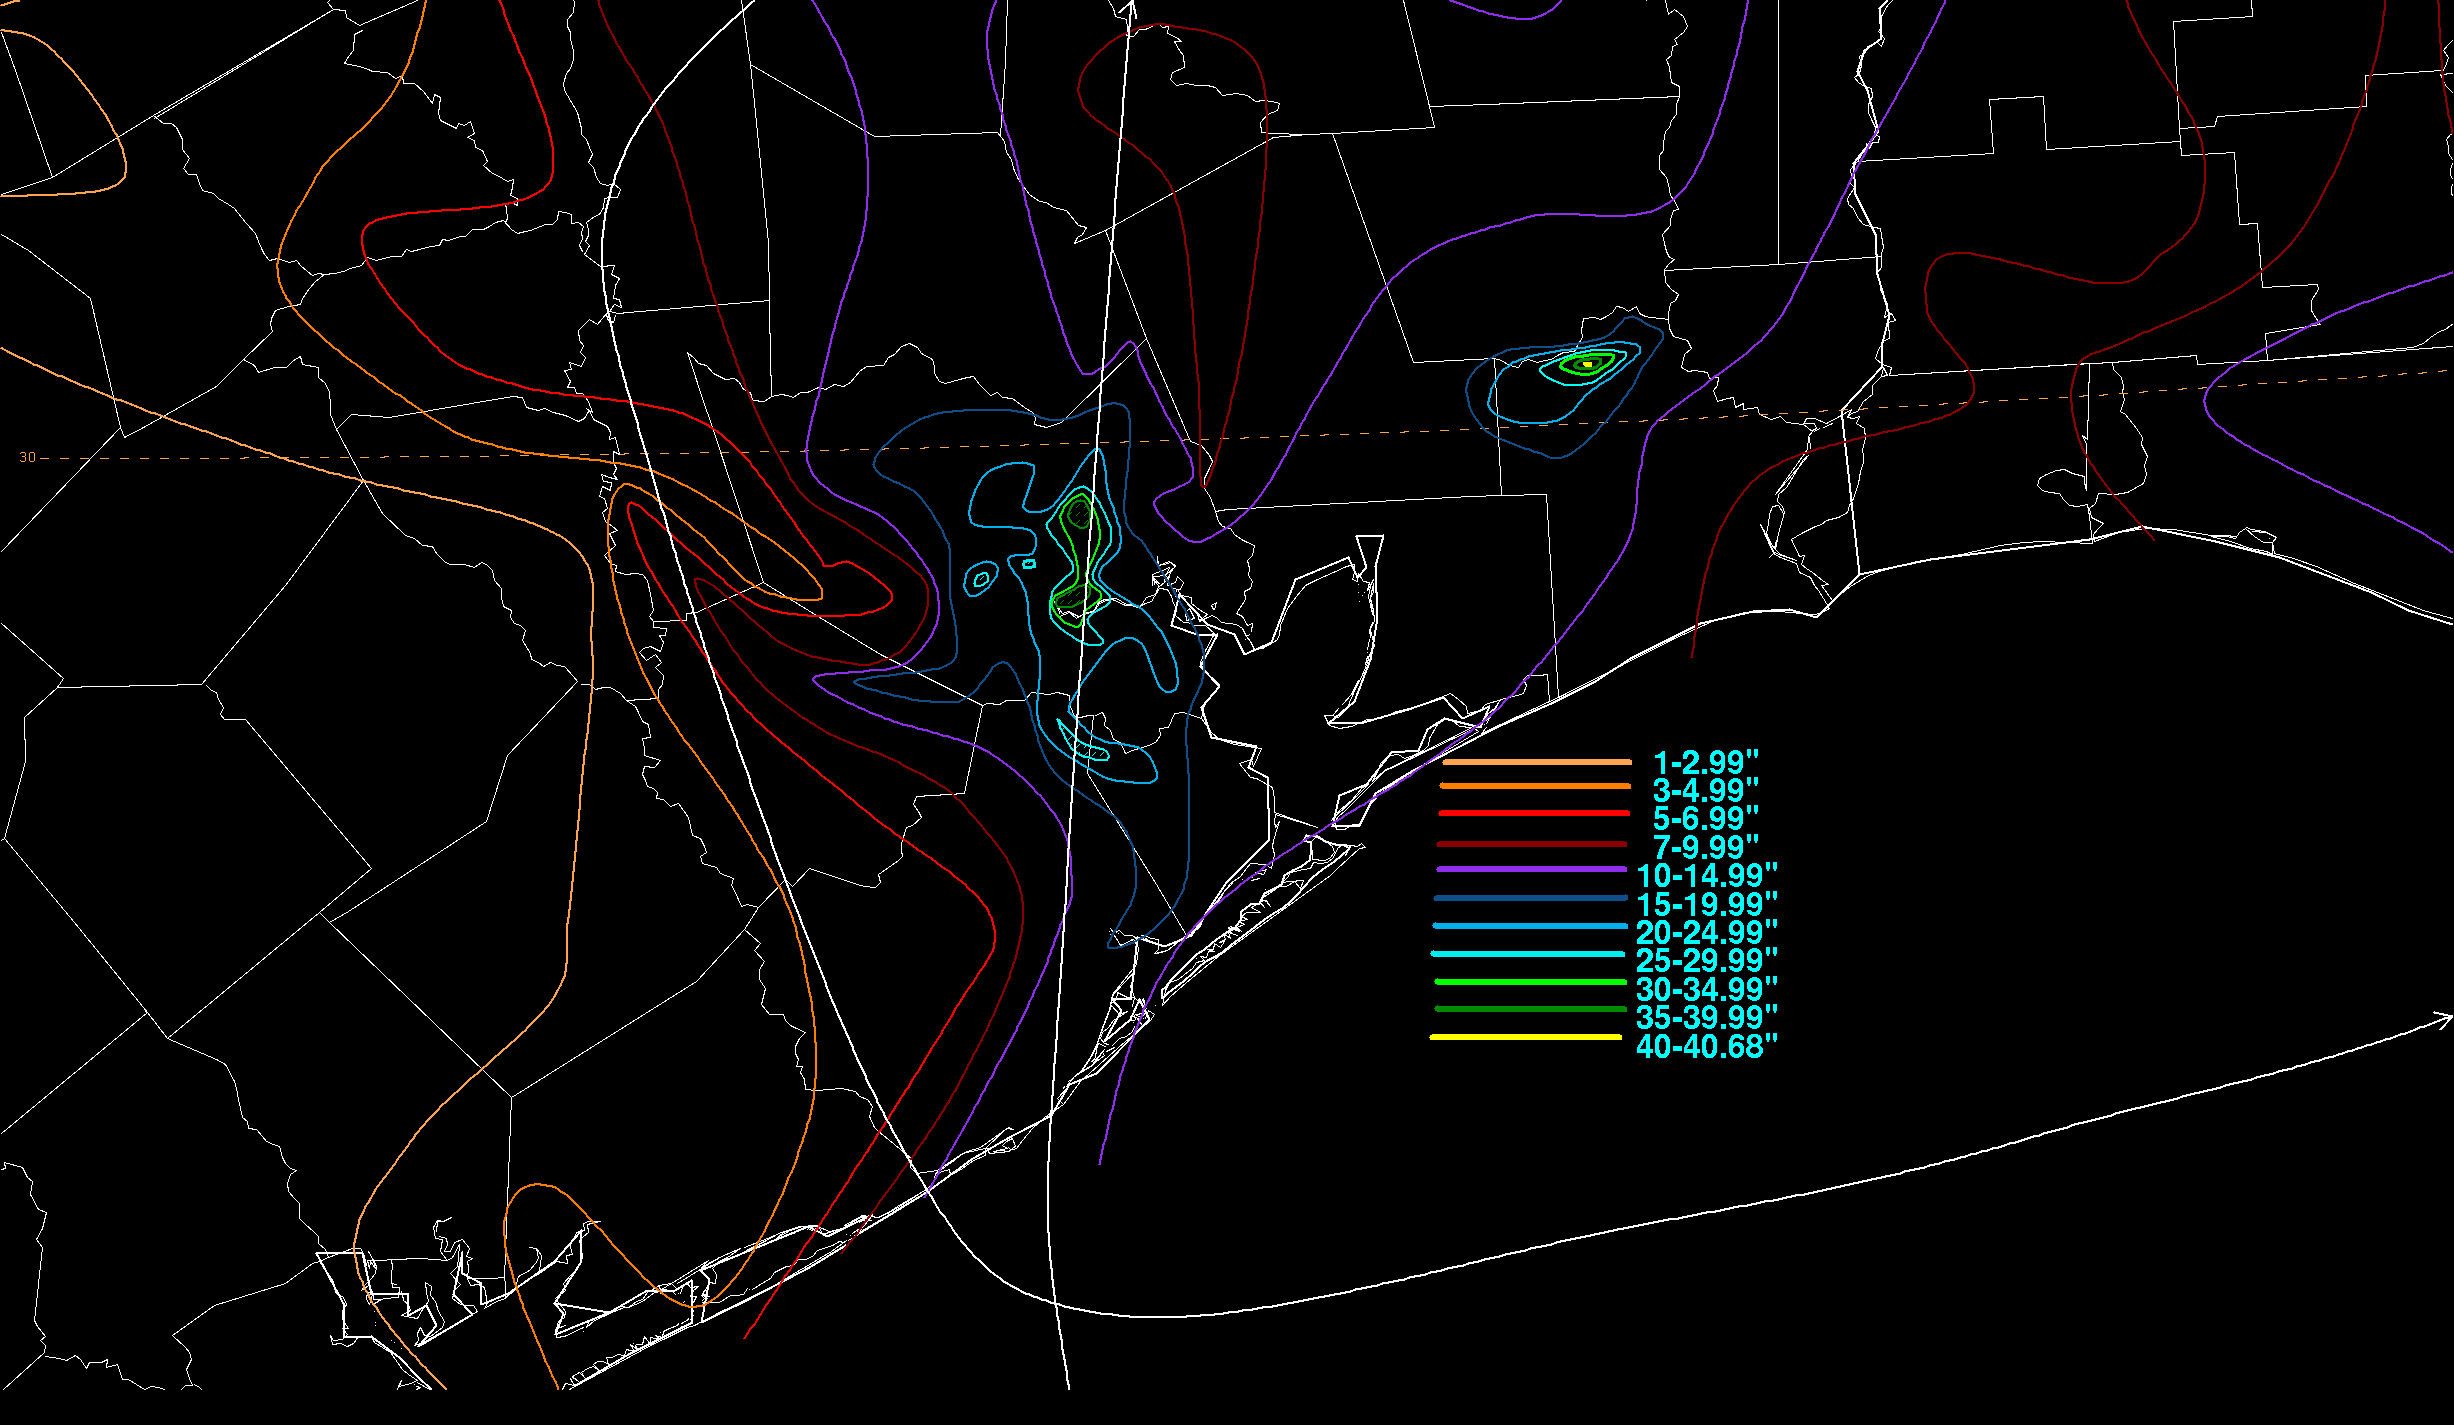
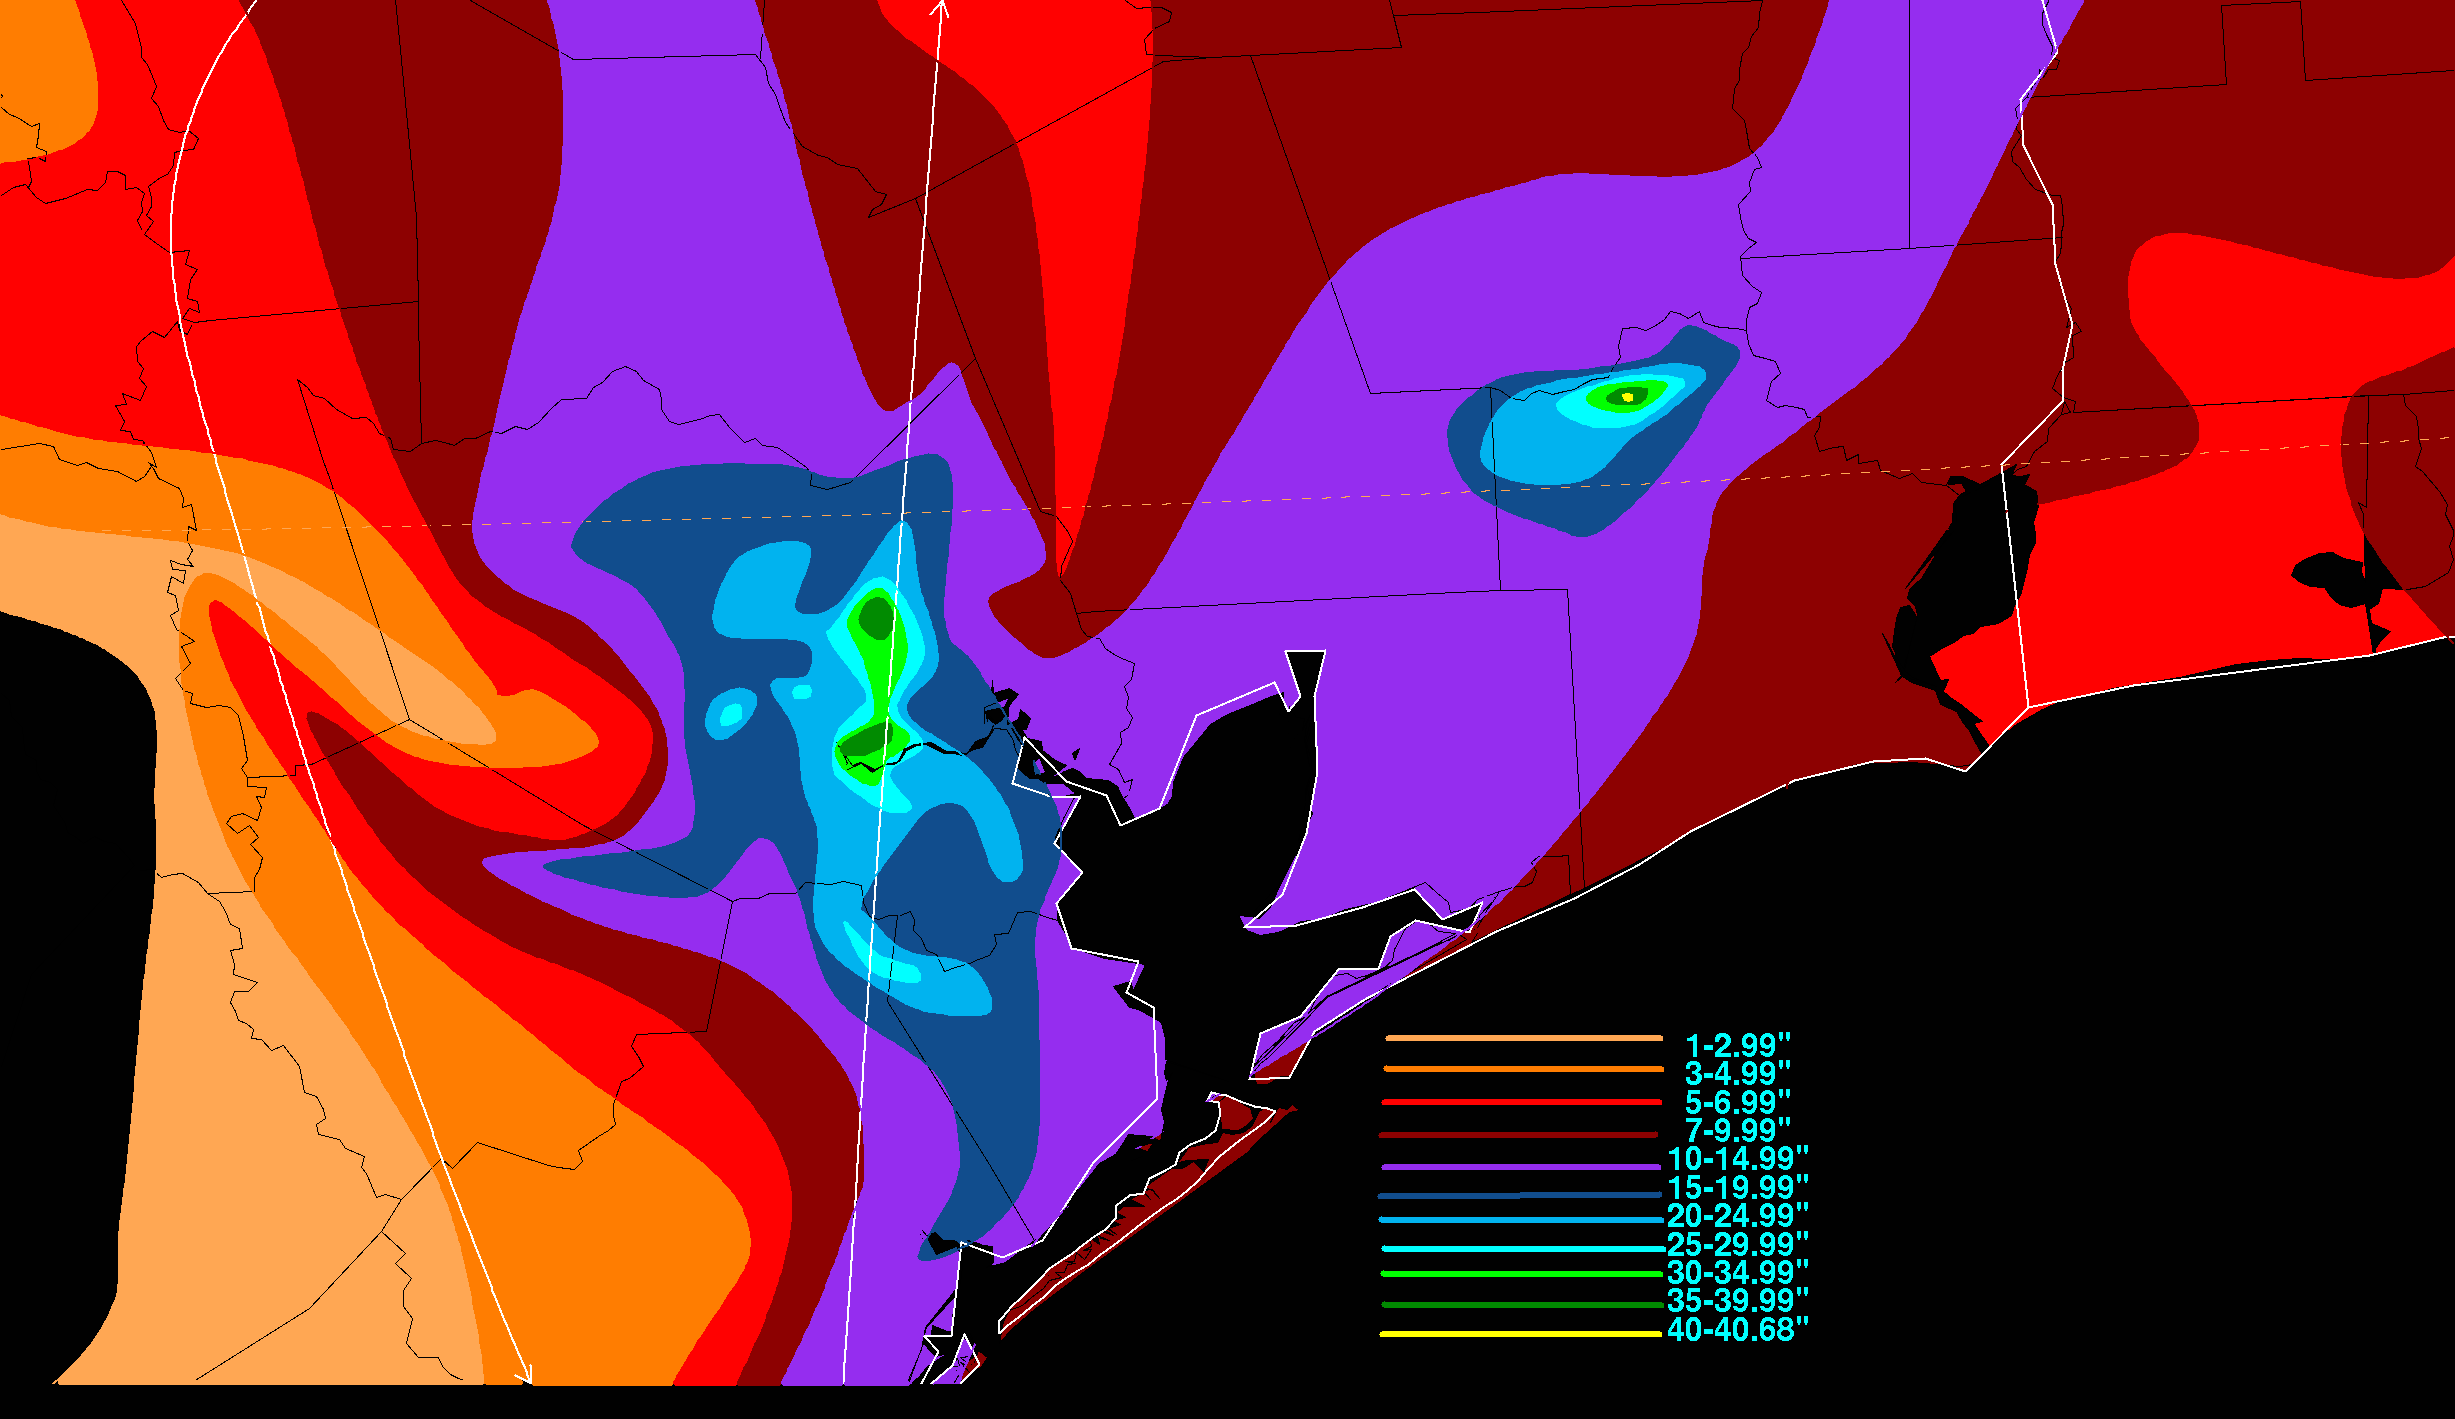
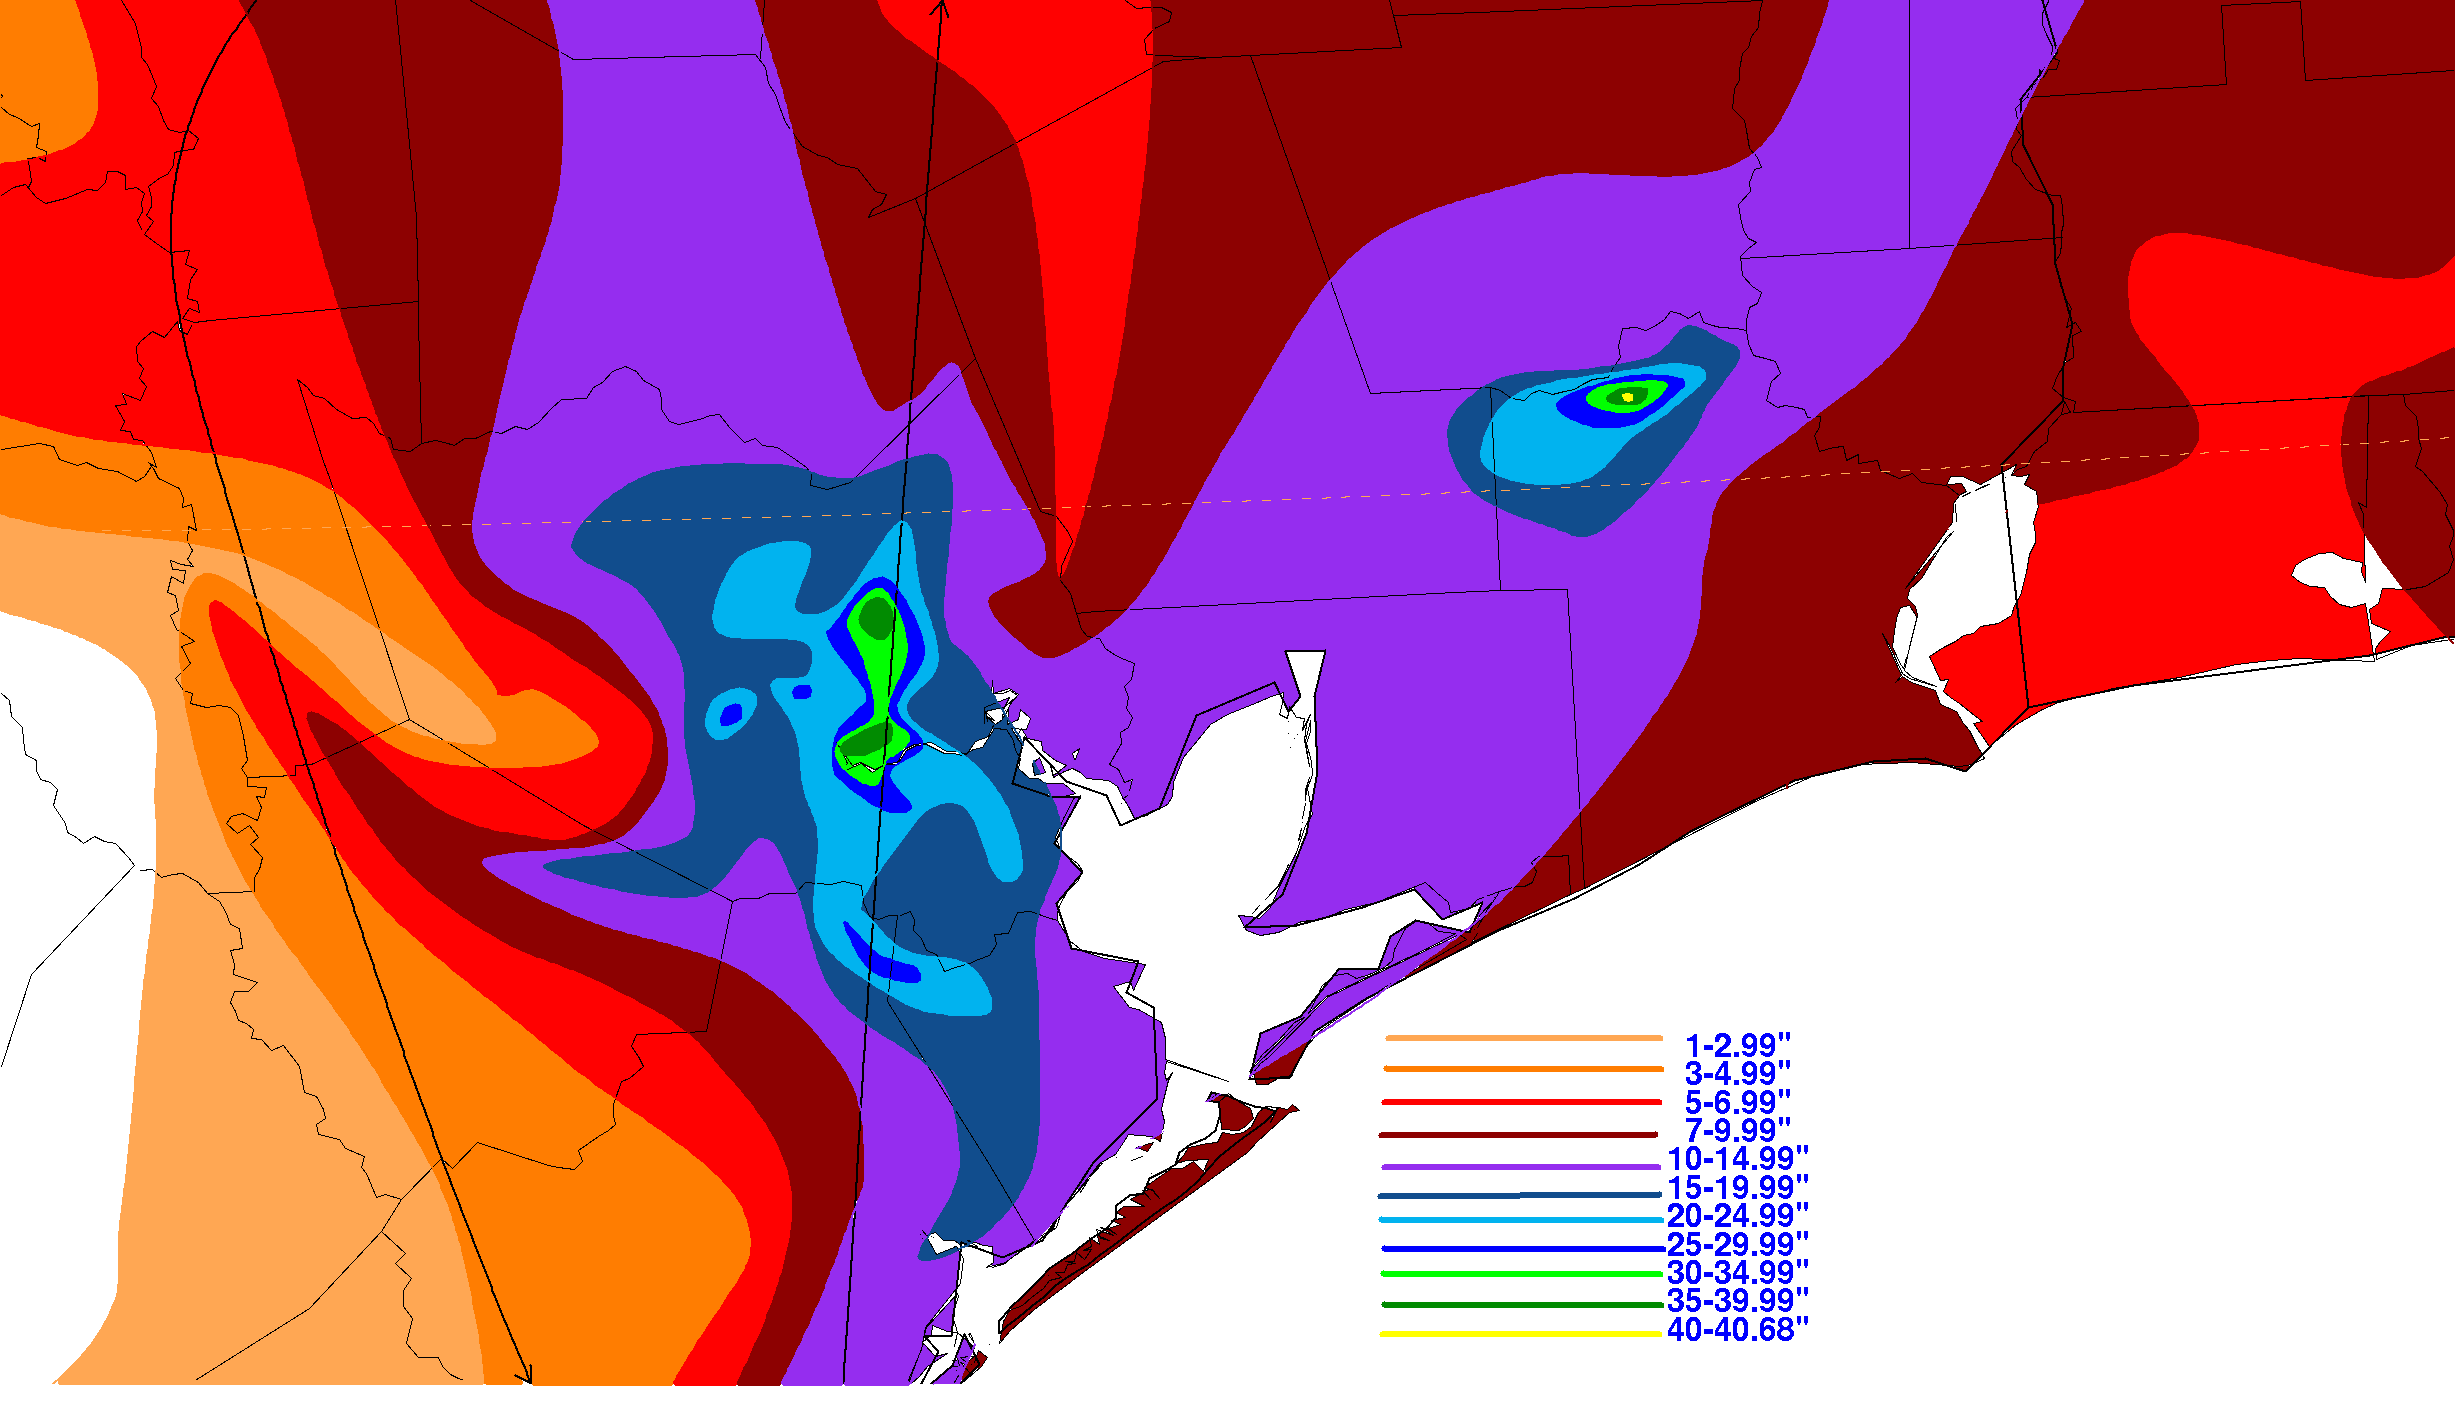
This set the stage for massive flooding in southeast
Texas on on the
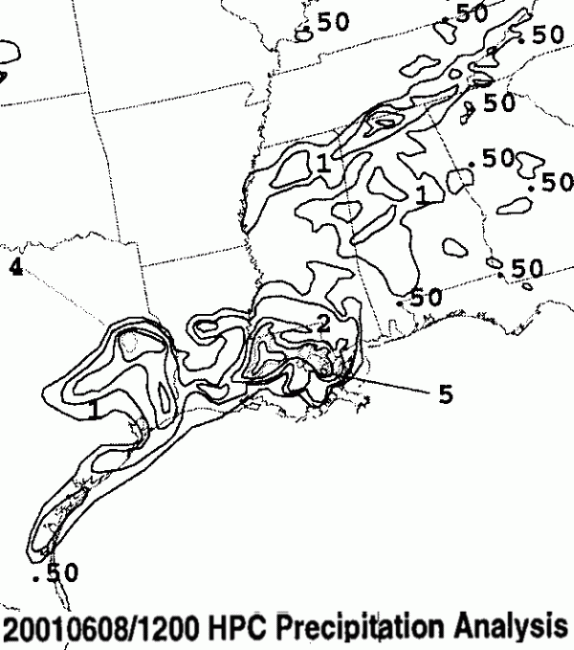
7th and 8th. The highest totals
noted were 36.99 inches at the Port of Houston Texas, and 29.86 inches
at Thibodaux Louisiana.
Portions of Houston, Beaumont, Thibodaux, Lafayette, New Orleans, and
Baton Rouge saw severe
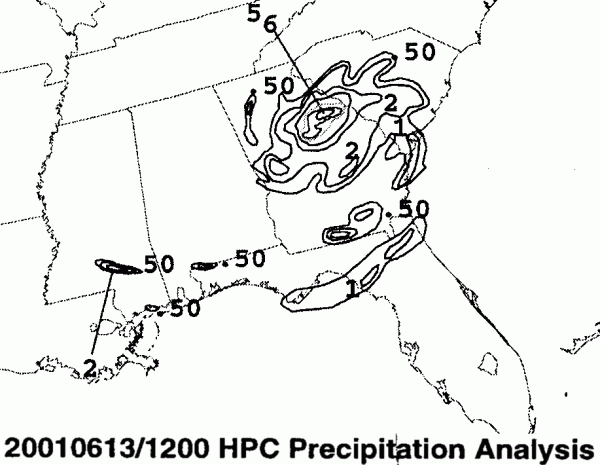
flooding from all this rain. Rains would continue into the 11th, as
Allison moved back off the Texas
coast, paralleling the coast of Louisiana before making a second
landfall
in the Teche region of the
Bayou State.
Reintensifying over land as it tracked through southeast
Louisiana and
southwest Mississippi,
Allison formed an eye feature during the morning of the 11th, a rare
accomplishment for a tropical
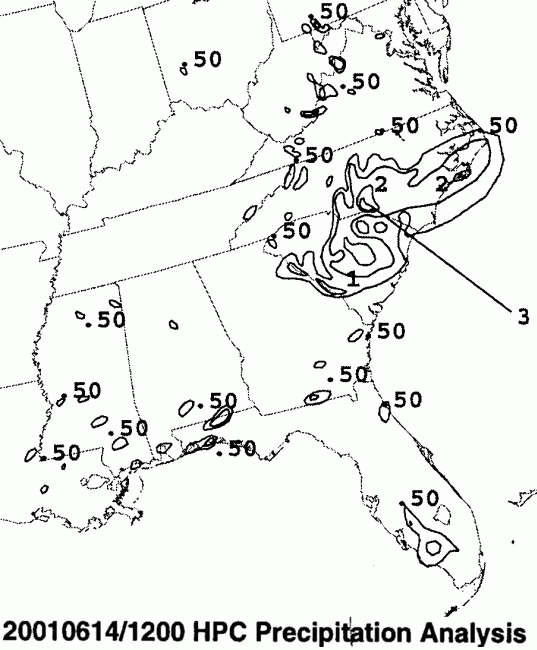
cyclone over land. The system moved swiftly east-northeast
crossing southern Mississippi and
Alabama, central Georgia, and South Carolina, being steered by the
subtropical jet stream to its
north.
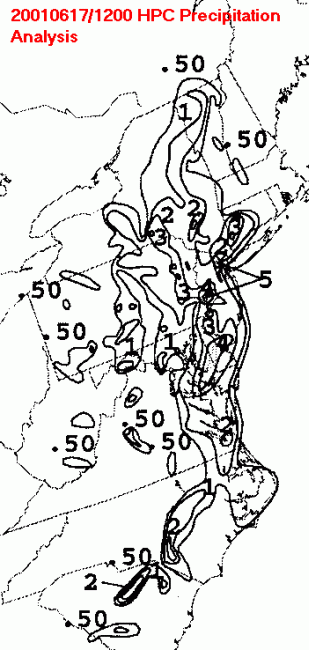
Motion slowed as it approached a blocking ridge of high
pressure off
the coast of New
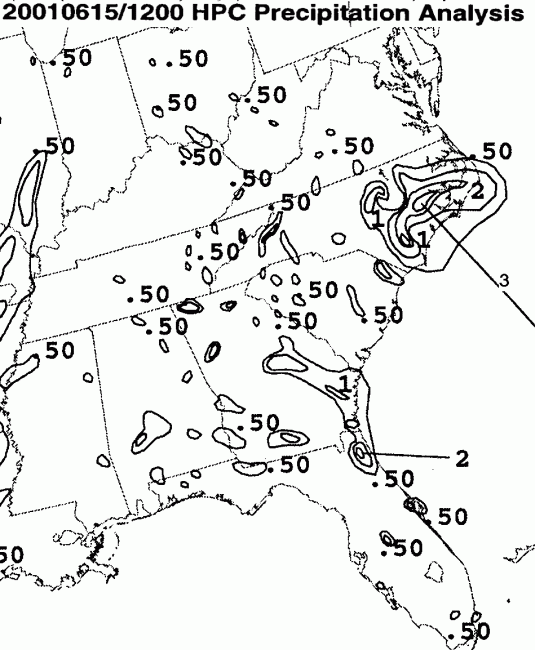
England, which then allowed the cyclone to move northward along the
coast of the Mid Atlantic
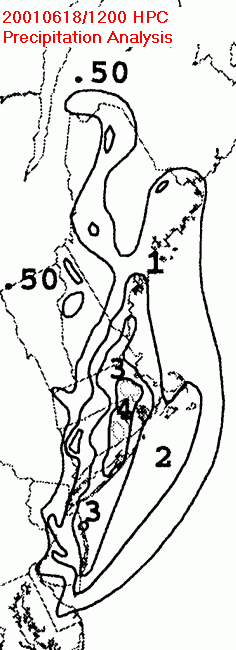
and just offshore New England from the 16th through the 18th.
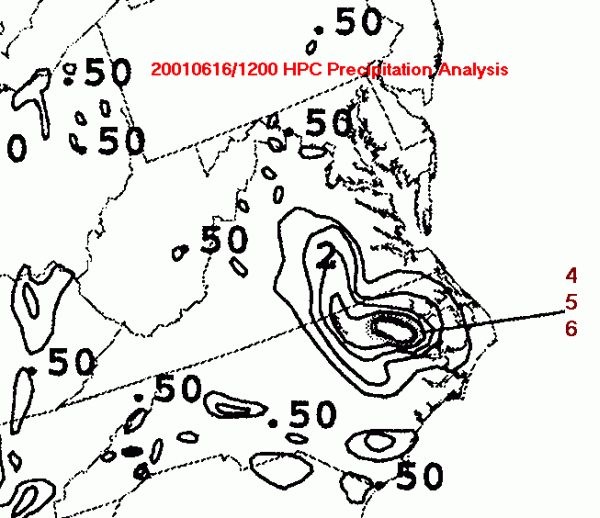
Significant floods occurred in
northeast North Carolina and southeast Pennsylvania during this time
frame, with areas measuring
10 inches of rain within 6-12 hours. The last of the heavy rains with
Allison escaped off the
Eastern Seaboard during the early morning hours of the 18th.
Damages as of this writing are estimated at $5
billion...with over $4
billion in the state of Texas.
This makes Allison the most costly tropical cyclone in Texas
history.
Its track lies below.
|
