A vigorous tropical wave left the coast of western Africa on August
14th. Initially moving over
upwelled waters, the system was slow to develop. Once it moved
over warmer waters to the
west and southwest, thunderstorm activity began to increase with the
system. By the 19th, a
closed low level circulation was apparent, and it became a tropical
depression. Tropical storm
status was achieved on the 20th while rounding the base of the
Azores-Bermuda
High in the
middle of the tropical Atlantic.
Moving west-northwest just to the north of the Lesser Antilles,
Bonnie's
wind speeds increased
to the threshold of hurricane strength. On the 23rd, the deep
flow around the high collapsed,
and the storm was dragged northward by an upper level low to its
west.
After the high re-
stablished itself on the 25th, the cyclone curved to the northwest
until it passed by the ridge
axis and recurved just off the coast of South Carolina. Bonnie
struck Wilmington, North
Carolina during the morning of the 27th as a category two hurricane,
then accelerated north-
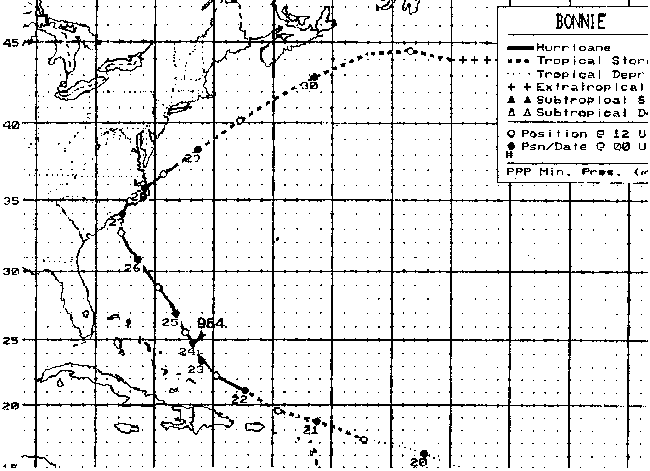
east into the shipping lanes of the northern Atlantic. Its track
lies below.
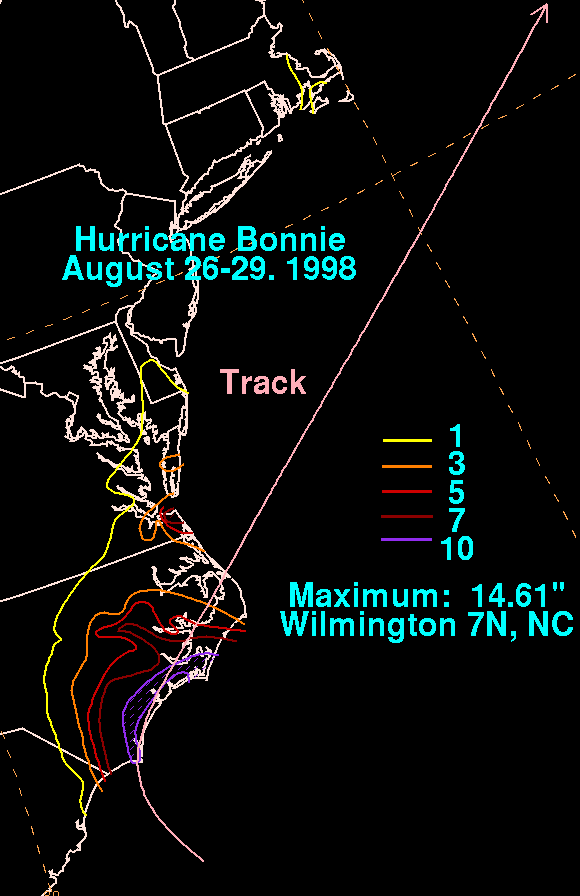
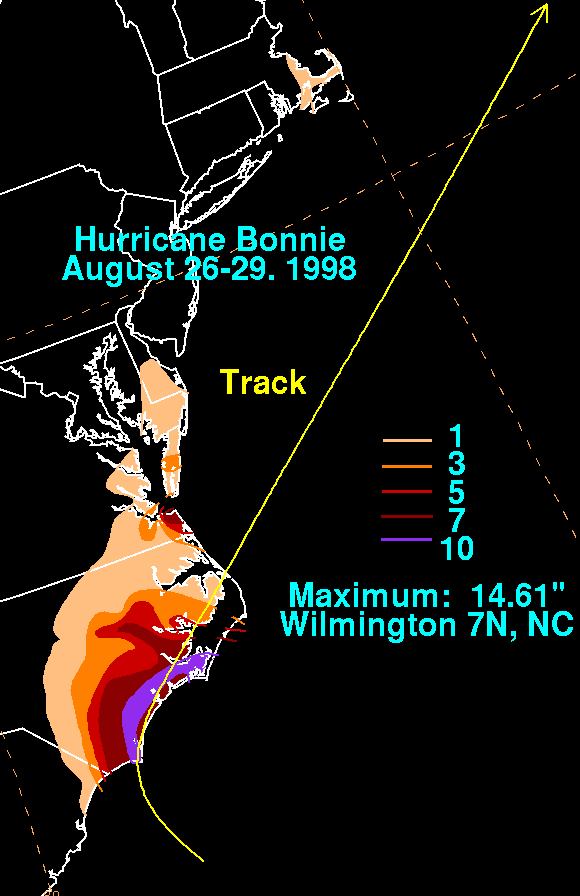
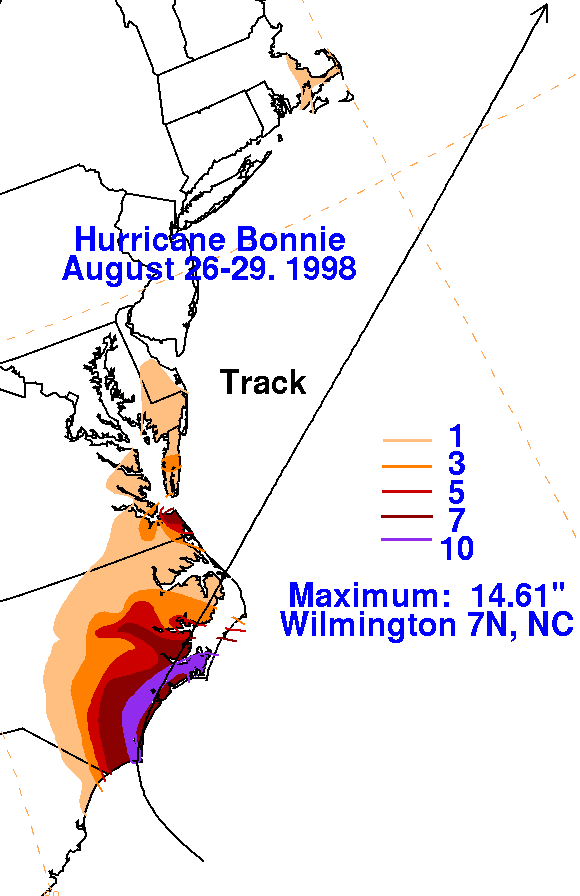
Below are the storm total rainfall maps for Bonnie. Note the
maximum
near the initial point of landfall
near Wilmington, NC, and the secondary maximum across extreme
southeastern
Virginia early the
next morning, in an inflow band to the north (or left) of the
track.
The rainfall map was produced
with information gathered from the Hourly Precipitation Data and
Climatological
Data publications
from the National Climatic Data Center, checked against the storm
totals
derived at the Southeast
Regional Climate Center, and the rainfall numbers in the preliminary
post storm report issued by the
National Hurricane Center.
 |
 |
 |
Below is the calendar for Daily Precipitation Maps. Note that
the 24-hour periods end
at 12z that morning.
