Spawned by a tropical wave, a convective system organized 60 miles west of Grand Cayman Island. Developing
rapidly, it became a hurricane the following day (the 15th) as it brushed the western tip of Cuba. By that afternoon,
Camille had already become a major hurricane. Strengthening resumed once Camille moved away from Cuba, and
reconnaisance aircraft found a category 4 hurricane on the 16th as it continued moving north-northwest. By evening,
Camille reached category 5 intensity. Around midnight on the night of the 17th, Camille came ashore just east of
Bay St. Louis. Hurricane force winds in gusts spread northward past Jackson. Camille weakened to a tropical
storm after passing Jackson and a tropical depression as it entered Tennessee. Recurving across western Tennessee
and Kentucky, Camille turned east as a cold front approached from the north. Upslope flow near the frontal boundary
in Virginia combined with the approach of Camille led to the heaviest rains ever recorded in Virginia from a tropical
cyclone. The James river experienced its worst flooding in over a century. Landslides occurred along eastern slopes
of the mountains, leading to significant destruction and loss of life. By the afternoon of the 20th, Camille moved
offshore into the Atlantic regaining tropical storm strength. By the 22nd, Camille merged with another frontal
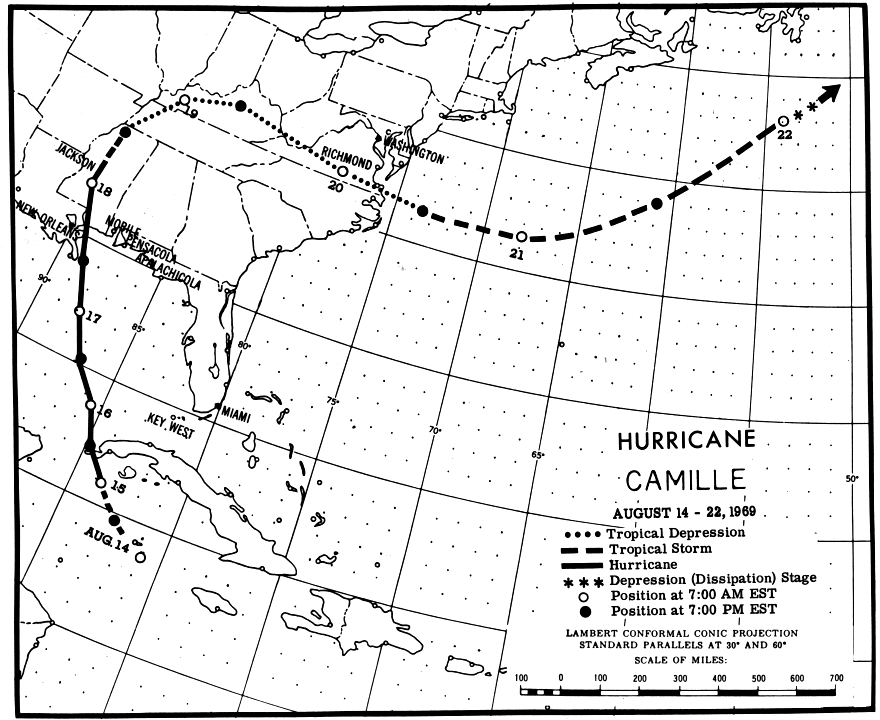
zone and was declared extratropical. Its track below was supplied by the National Hurricane Center.
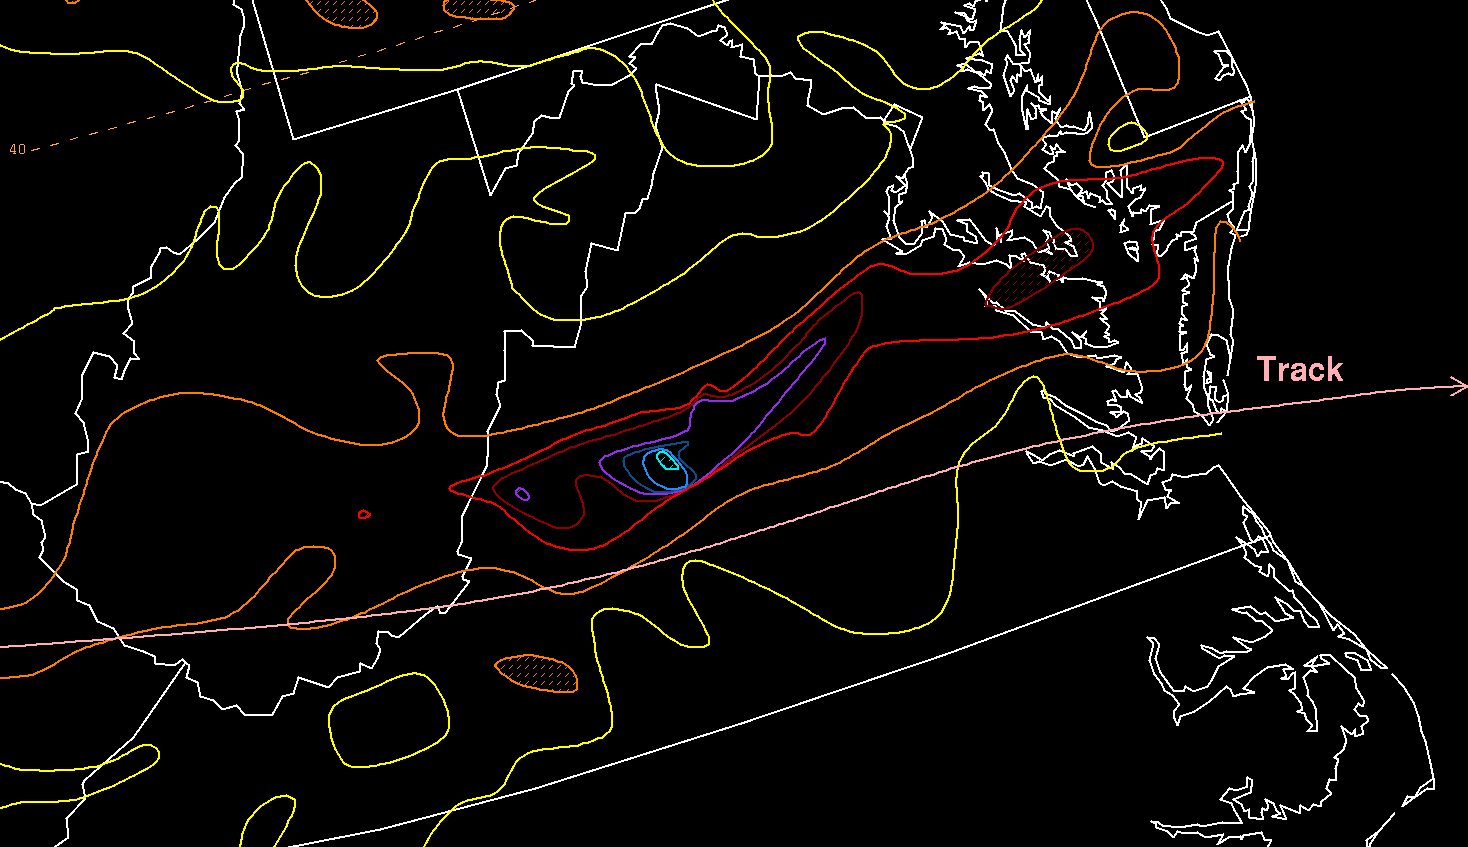
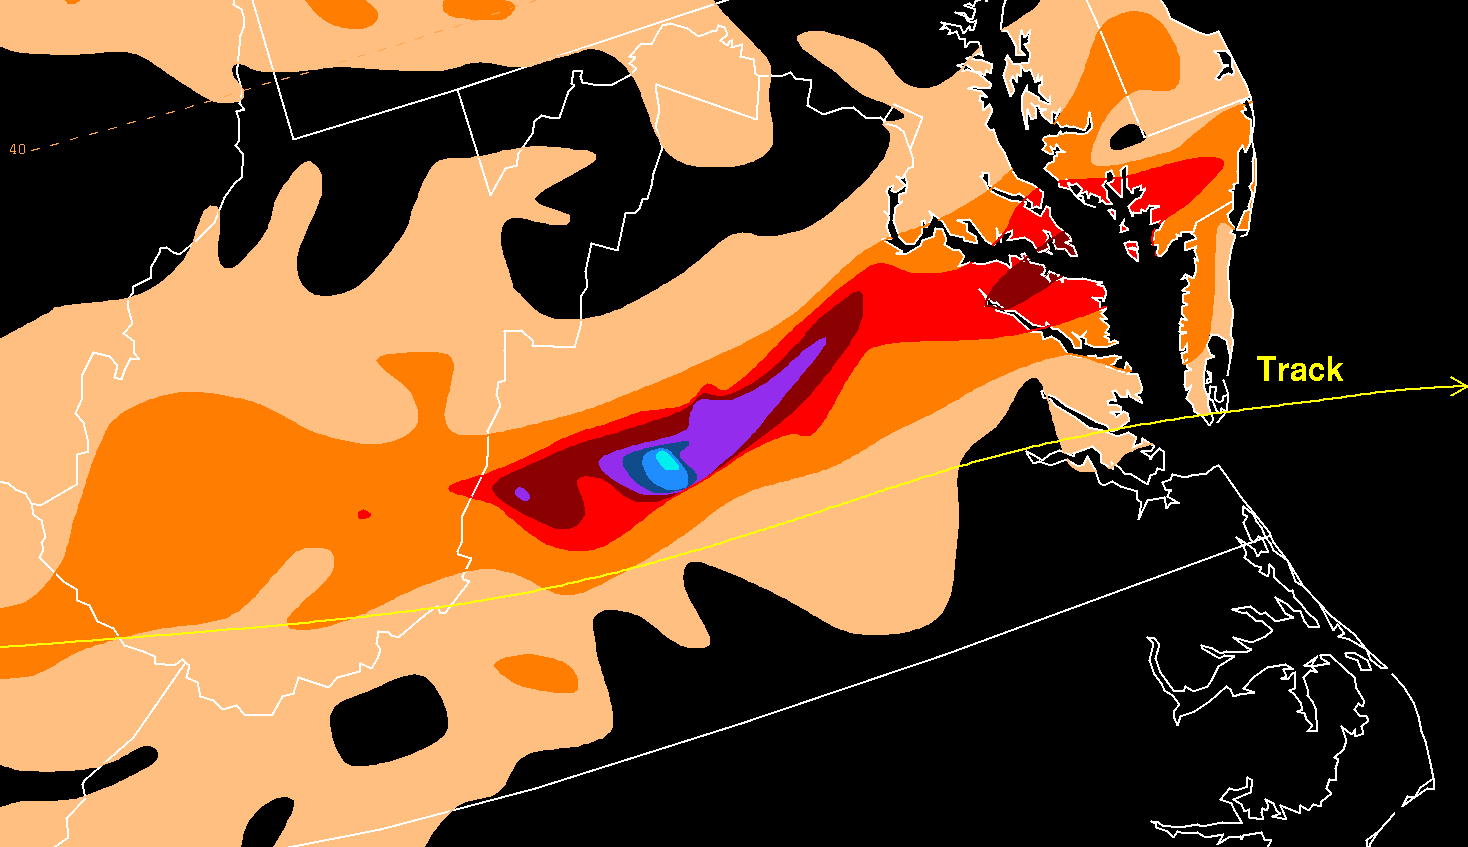
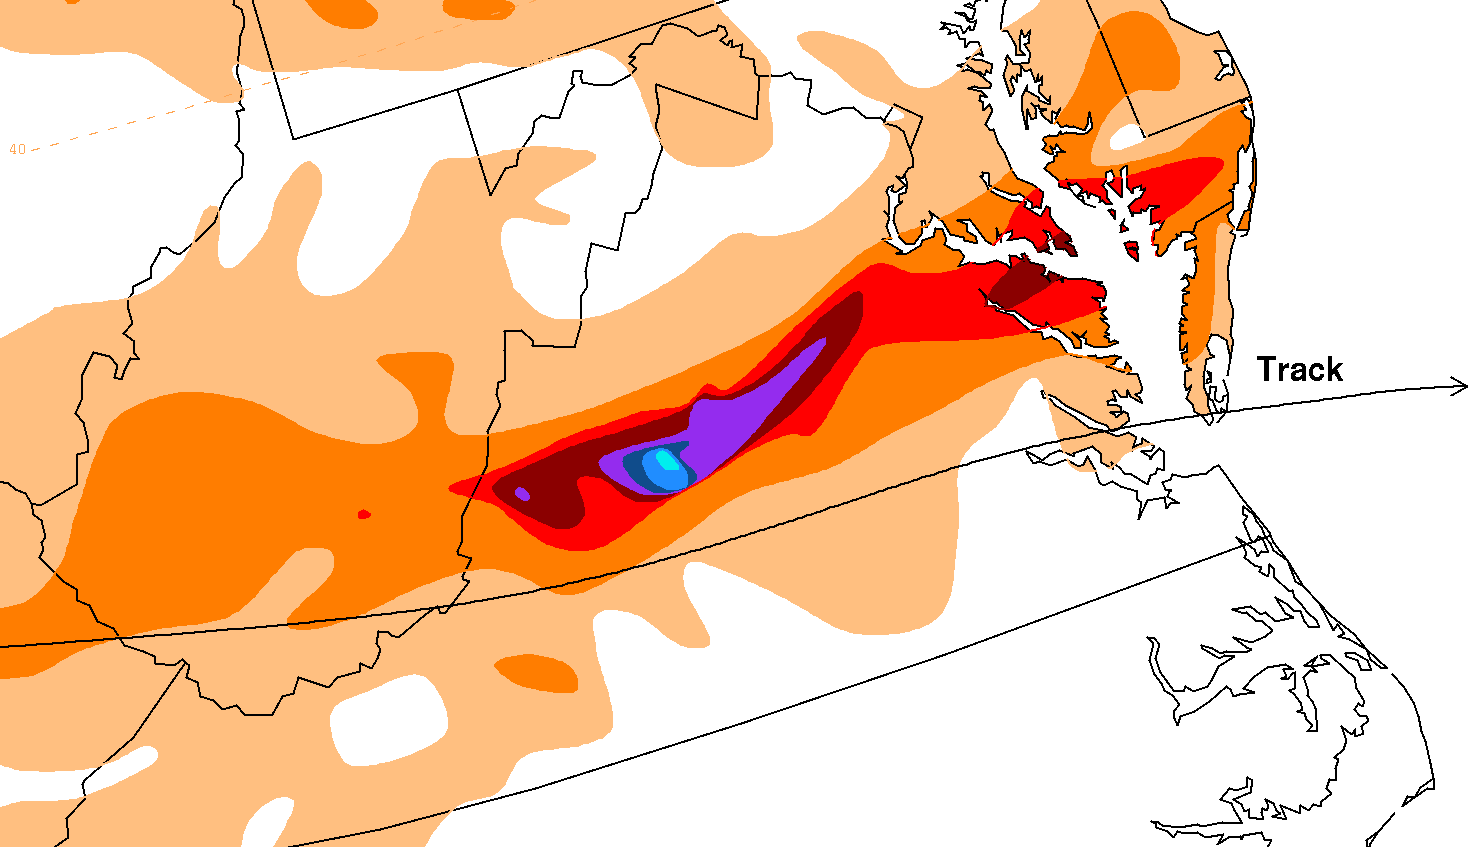
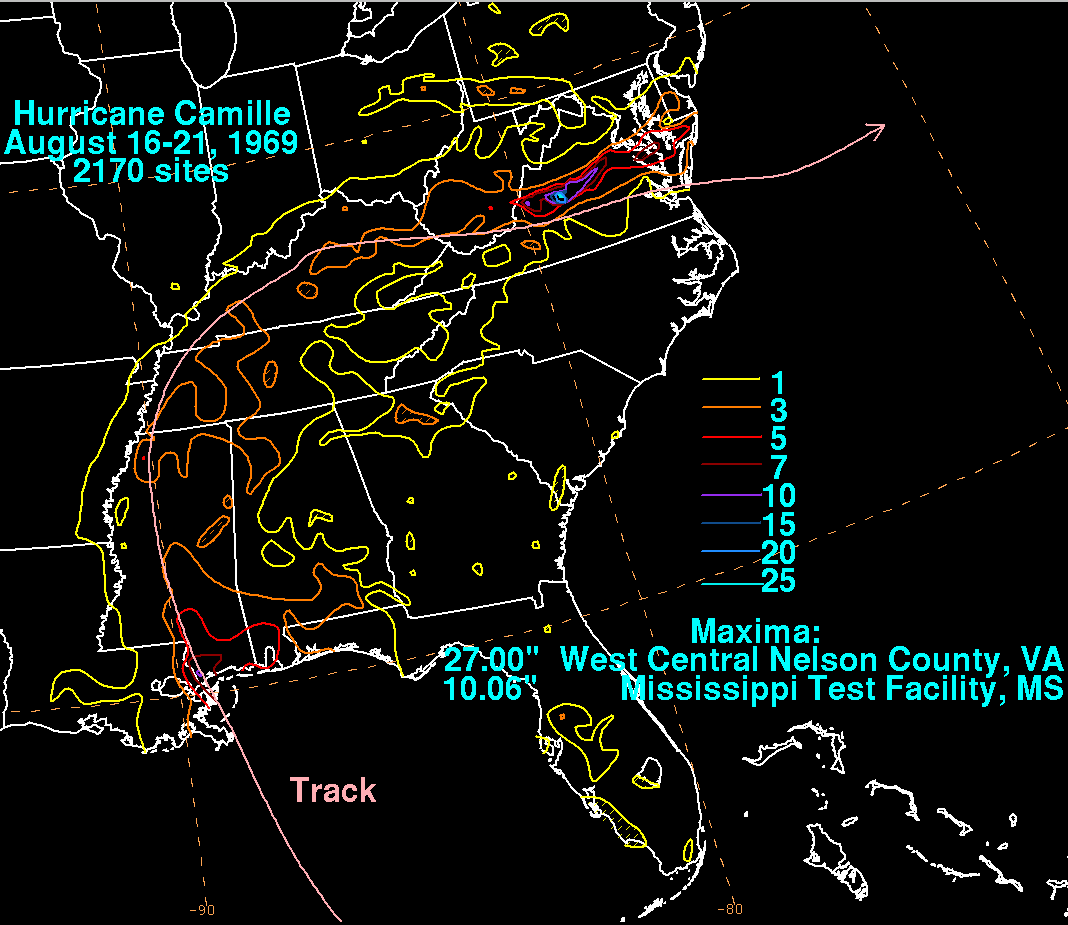
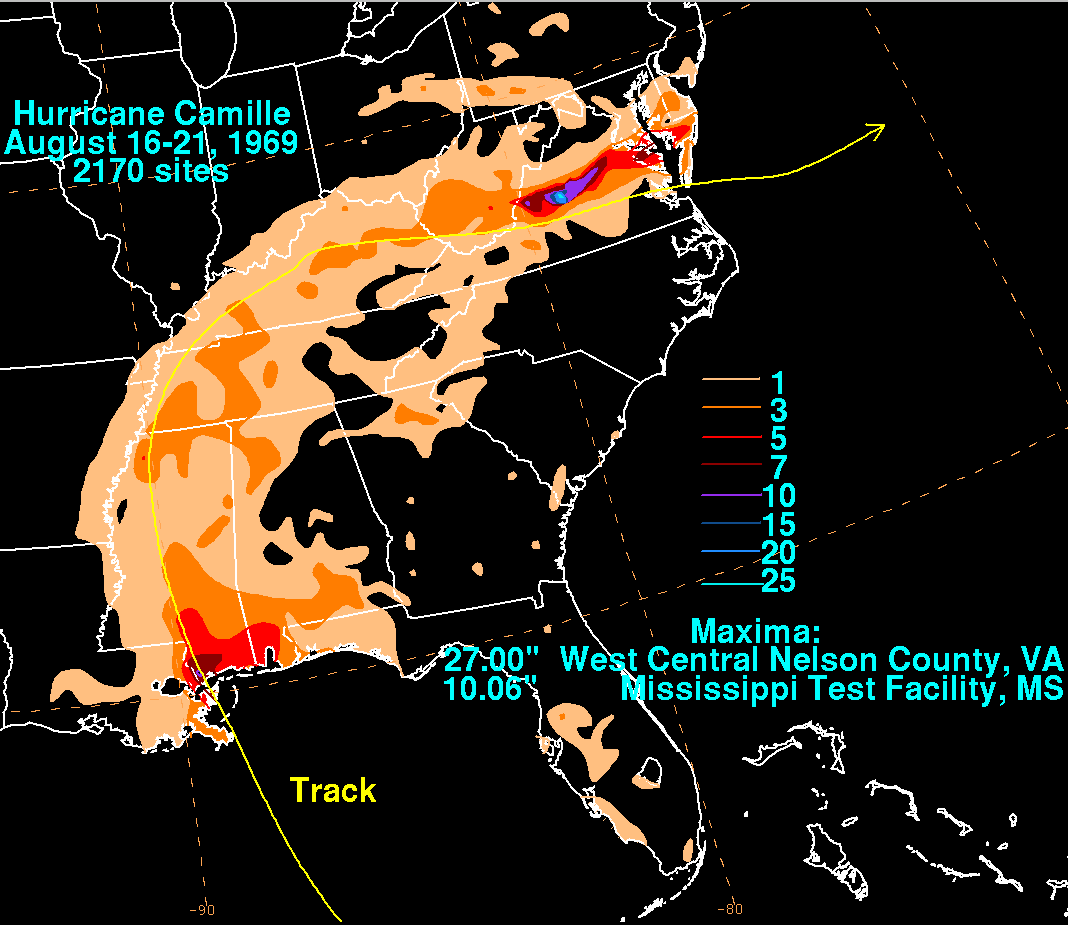
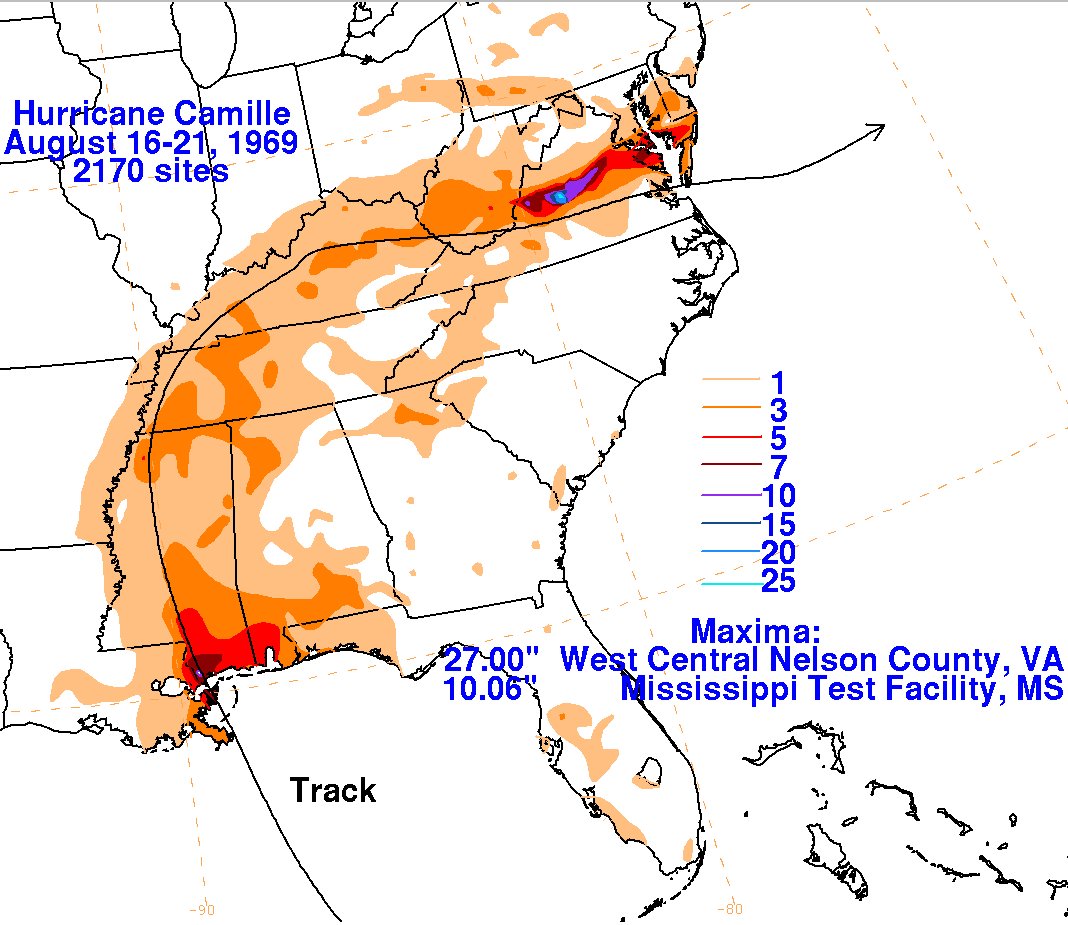
The graphics below show the storm total rainfall for Camille. Data was provided by the National Climatic Data
Center in Asheville, North Carolina, the U.S. Geologic Survey, and the U.S. Army Corp of Engineers.
 |
 |
 |
Below is the daily calendar of rainfall, with 24 hour amounts ending
at 12z in
the morning that day. Surface analyses
are from the start of the rainfall period (i.e. surface map from 17th
at 12z will underlay the precipitation which
falls between the 17th and 18th at 12z). The time 12z corresponds
to 8 am EDT, or 7 am CDT.
| Sun. |
Mon. |
Tue. |
Wed. |
Thu. |
Fri. |
Sat. |
| 18 |
19 |
20 |
21 |
