About the QPF Cluster Prototype Page
***This is an experimental product from WPC-DTB***

Overview

   
Ensemble clustering has become a popular way for forecasters to visualize large ensemble forecast datasets. Ensemble clustering partitions the members of an ensemble into groups of members that have similar forecasts (i.e., discrete forecast scenarios), allowing forecasters to dig more into the data and get more complete information about forecast uncertainty in space and time without data overload. WPC created a popular ensemble clustering tool to assist forecasters in their preparation of 3-7 day forecasts. This tool groups together ensemble members with similar 500-hPa geopotential height forecasts. Verification has shown that these clusters adequately summarize the variability in temperature forecasts among the constituent ensemble members. However, this methodology can struggle to adequately depict the variability in the precipitation forecasts among constituent members. To address this, an ensemble clustering tool developed specifically for precipitation forecasting was developed. 


Ensemble Clustering Methodology

    WPC's QPF clustering tool uses a version of ensemble clustering known as Fuzzy Clustering. This methodology has 3 steps:

1. Evaluate and interpret the first two Empirical Orthogonal Functions (EOFs) of a relevant ensemble forecast variable over a region of interest.
2. Use k-means clustering on the Principal Components (PCs) for the EOFs to create clusters of similar members.
3. View the clusters.
Relevant Forecast Variable and Region
Since we are interested in precipitation forecast scenarios, the forecast variable that EOF analysis will be perfomred on is 24-hour or 48-hour QPF from the National Blend of Models' Quantile Mapped and Dressed ensemble member dataset.
Experimental Website Layout
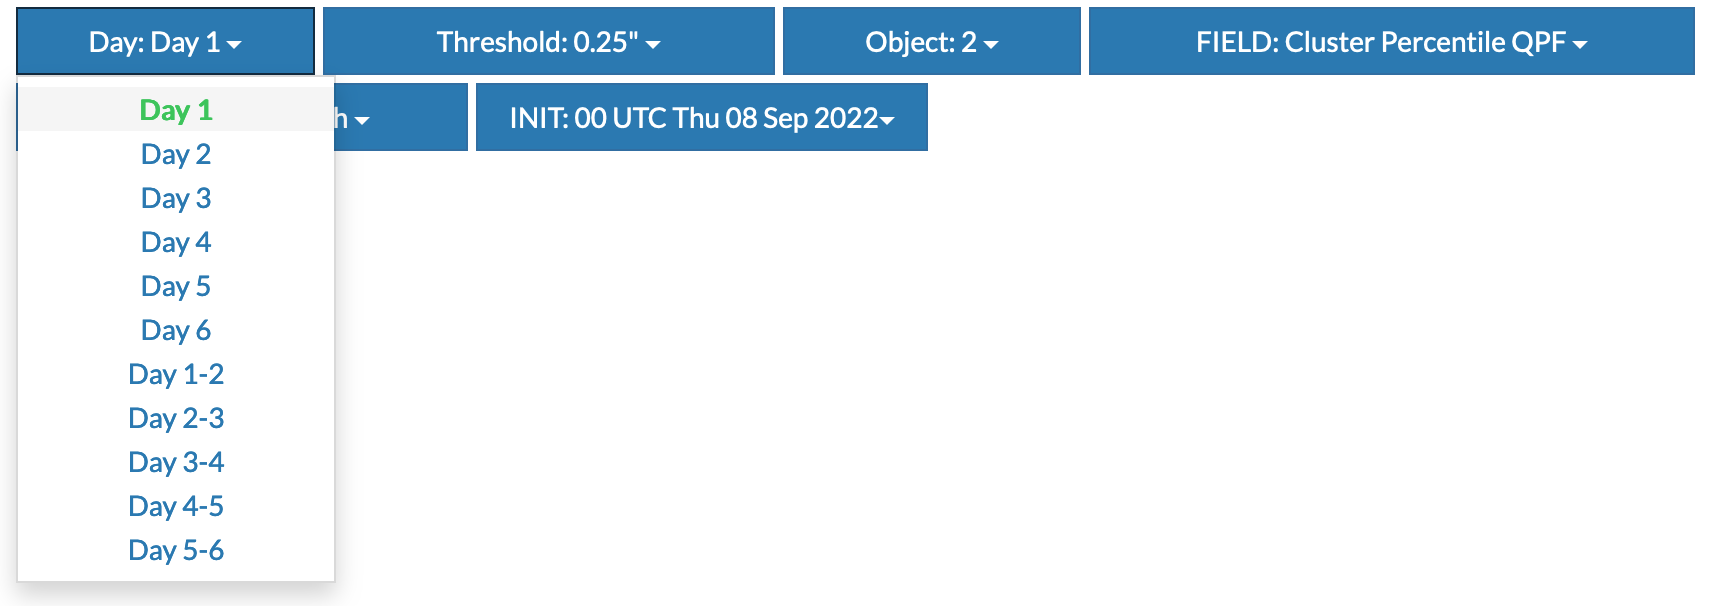
Day:

        The website defaults to the day 1 precipitation scenarios, but use the dropdown menu to select the one day (24-hour) or two day (48-hour) period of interest.
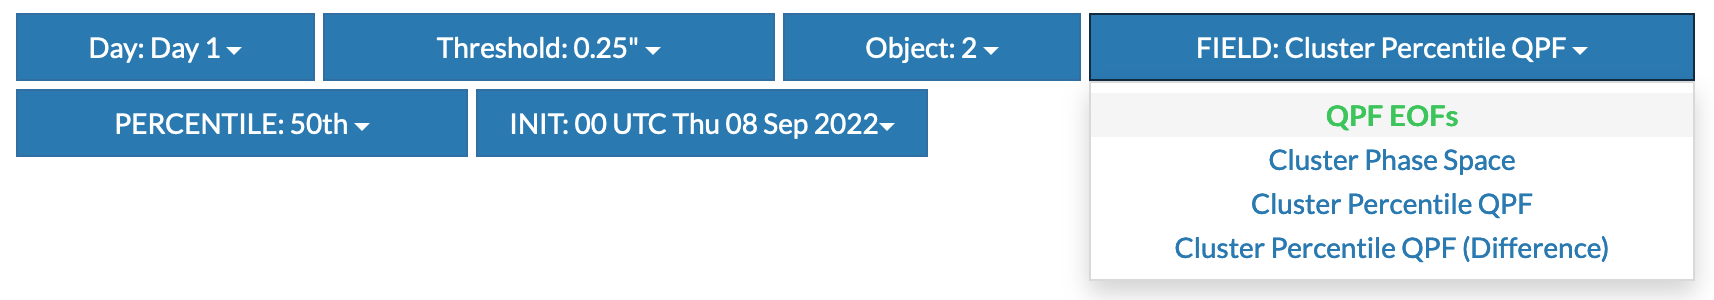

Field:


        Use this dropdown menu to switch between the different fields. If you select a percentile field, use the next dropdown menu to switch between the different percentiles. These are raw precentiles computed from the membership of each cluster.


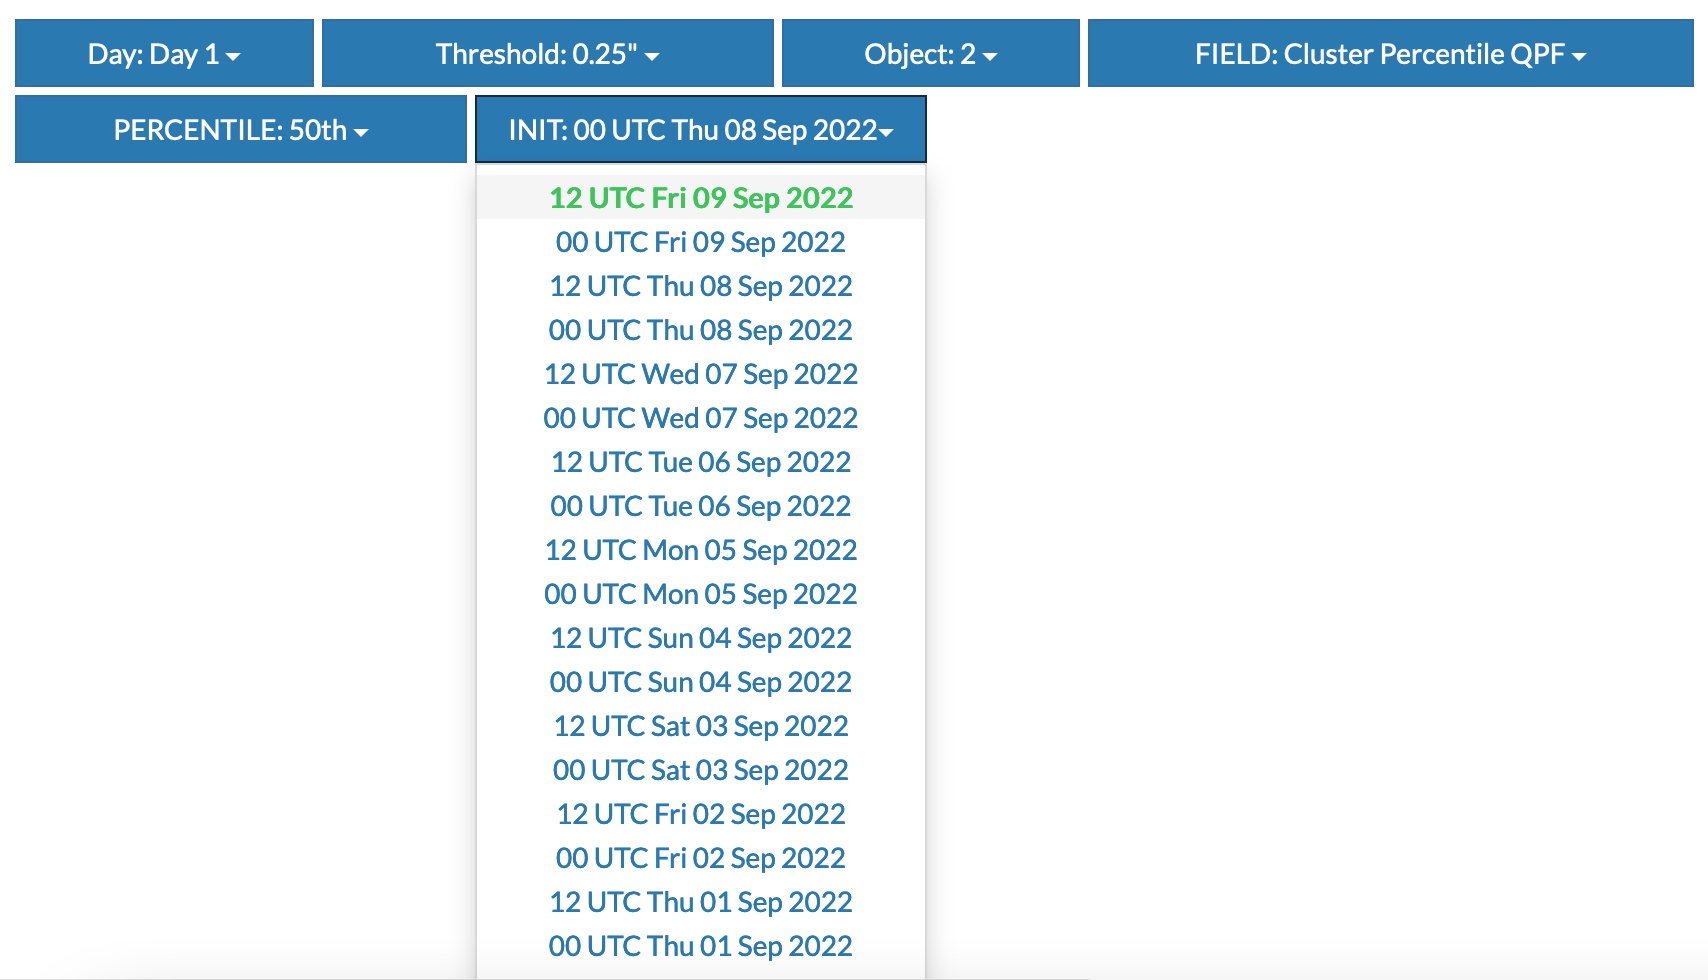
Initialization Time:


        Use this dropdown menu to switch between different initialization times. There is an archive that goes back 3 weeks.