Extreme(Historical) Event Monitor
About this Product
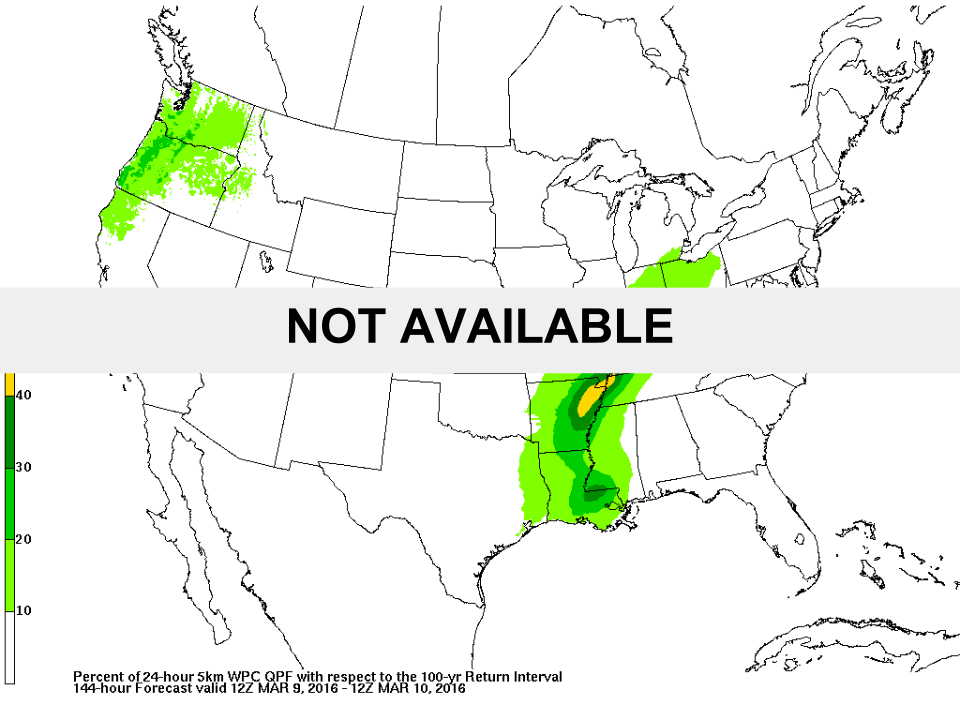
The Extreme Event Monitor indicates when the Weather Prediction Center (WPC) is forecasting rainfall approaching thresholds associated with a 100-yr Average Recurrence Interval (ARI). An ARI describes the probability of a particular event occurring at any one location in any given year. For example, precipitation thresholds that have a 100-yr ARI have a 1-in-100 chance (i.e., 1% probability) of occurring in any given year. Precipitation that exceeds the 100-yr ARI threshold for a given duration are often categorize as extreme because they can lead to catastrophic flooding, major infrastructure damage, and even loss of life.
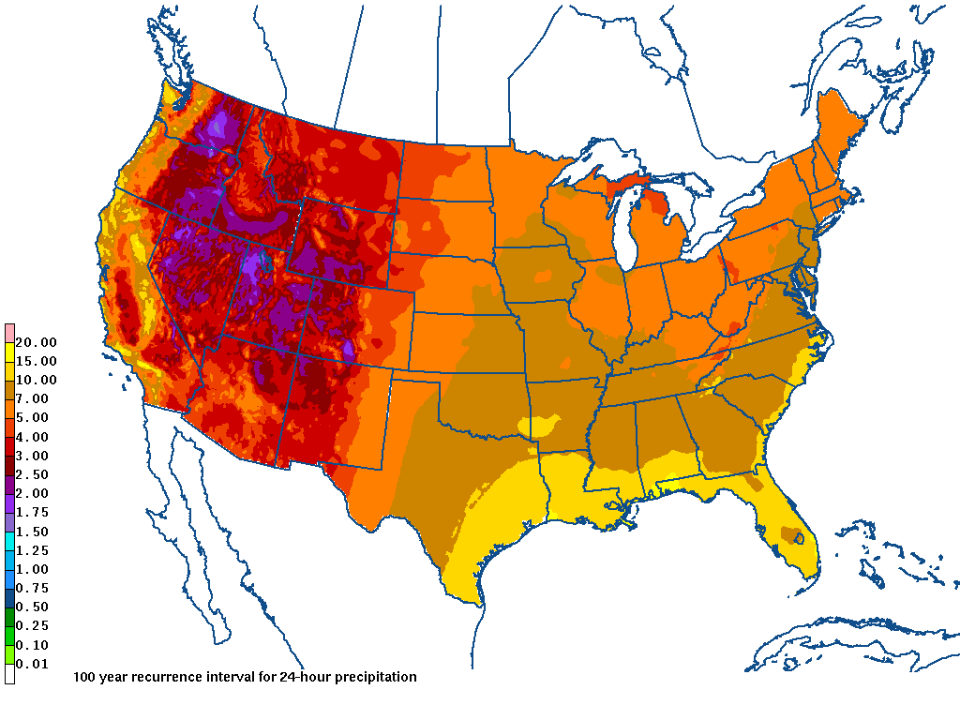
This product is generated with WPC's Quantitative Precipitation Forecasts (QPFs) and 100-yr ARI precipitation thresholds from the NOAA Atlas 14 database. In the national mosaic, the ratio of the QPF to the ARI are calculated at each point and expressed as a percentage for the 6- and 24-hr periods of the Days 1-3 forecasts. The value in recasting the QPF in the context of the 100-yr ARI is that it allows the user to measure the climatological significance of a forecasted or observed rain event for any location.
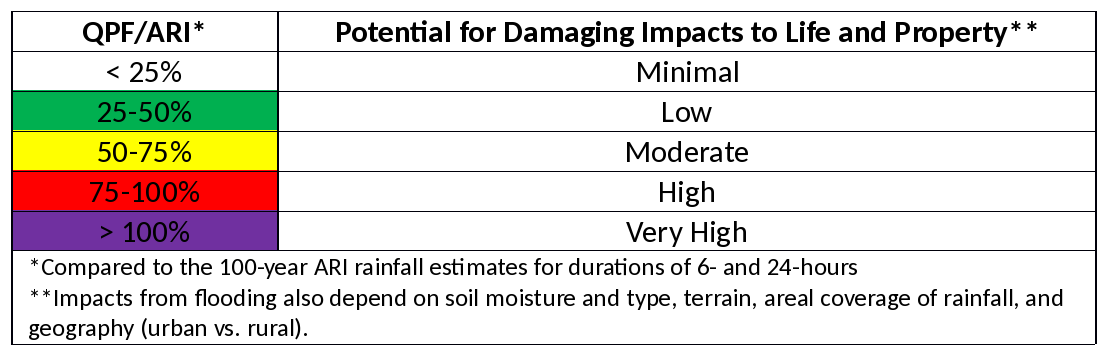
One caveat is that this product does not provide exact probabilities of flooding for a particular location, so it should be used in conjunction with other products, like the Excessive Rainfall Outlook, for a more accurate assessment of flood potential. In general, rainfall with a 100-yr ARI is usually associated with flooding, but the severity of flooding is also dependent geographic location (urban vs. rural), antecedent conditions (e.g., soil characteristics and terrain), and total areal rainfall coverage. Hydrologic structures (e.g., levees, culverts, and dams) are designed to withstand flooding from rainfall associated with ARIs ranging from 5-100+ years, meaning that once those thresholds are exceeded, the potential for structural breakdown increases. Dams and levees in large cities are usually designed to withstand flooding associated with rainfall from a 100-yr ARI, so once the QPF/ARI ratio exceeds 100%, (i.e., QPF/ARI > 100%), there is very high risk of structural failure and damaging impacts to life and property.
Extreme precipitation events are difficult to predict for both forecasters and NWP models. For example, lower-resolution NWP models, such as the GFS, tend to underforecast extreme events, usually verifying with QPF/ARI values closer to 75% of the total rainfall. Thus, high-risk areas include points where WPC forecasts QPF/ARI ratios greater than 75% of the 100-yr ARI. Ratios that are 50-75% of the 100-yr ARI pose a moderate risk because they are associated with heavy rain and possible flooding, especially when covering a large area. Ratios between 25-50% can still be associated with localized flooding, although potential for damaging impacts is low. If the QPF/ARI ratio is less than 25%, the text at the center of the graphic will read "WPC-QPF NOT EXPECTED TO EXCEED 25% OF THE 100-YR ARI."
The NOAA Atlas 14 data is available through the Precipitation Frequency Data Server, which provides point-based estimates of rainfall for ARIs between 1 and 1000 years for rainfall durations ranging from 5-mins up to 60 days based on a 90% confidence interval. Because the NOAA Atlas-14 update has not been completed for the pacific NW or Texas, the DOC Tech Paper 40 (1961) was used for TX, and the NOAA Atlas-2 (1973) was used for the Pac NW. These data were "stitched" together with the Atlas-14 data (courtesy of Dr. Russ Schumacher).