|
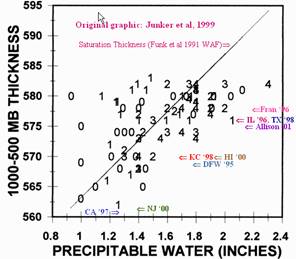
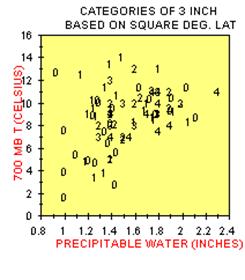
Junker et al. (1999) have noted that in reality that convective systems do form on the left side of the line where the mean RH is below 70% but that their scale tends to be smaller. In that 1999 study, MCSs were classified by the scale of their 3 inch or greater coverage. The figure above plots thickness versus PW with the diagonal black line given the saturated thickness values for PWs taken from the Funk table. All of the two largest scale category rainfall events (the most extreme ones) occurred along or to the right of the saturated thickness line. In other words, all occurred with a mean relative humidity that was equal to or greater than 70%. More recently, Kelsch noted that a number of severe flash flood cases occurred well to the right of the saturated thickness line. The small arrows on the figure above represent the thickness and PW that was present for various flash floods. The plot of the flash flood cases suggests that when a convective event occurs with at high precipitable water values relative to its thickness that the event should be monitored closely for its potential to produce heavy to extreme rainfall. |
|
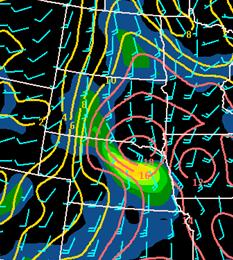
NAM forecast of boundary layer wind, moisture convergence and dewpoint |
|
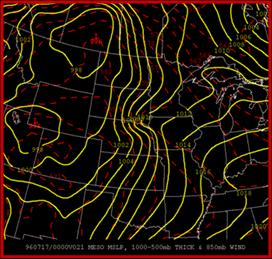
MSL and 1000-500 thickness forecast |
|
582 |
|
579 |
|
576 |
|
585 |
|
573 |
|
588 |
|
00 UTC 17 July |

|
03 UTC 17 July |
|
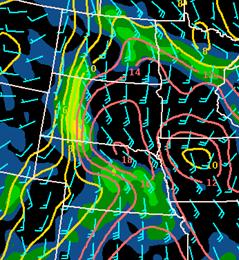
The figure at left shows the location of the axis of heavy rain according to the saturated and climatological thickness methods (transparent white area). The area suggested by either thickness method suggested that the rainfall event would be an elevated one to the north of the low level boundary and the boundary layer moisture convergence. The rainfall during the 24 hours was concentrated in this same area. |
|
The climatogical and saturated thickness methods provide one way of determining how close to the front to forecast the axis of convection in the plains. Another aid in determining whether convection will be capped or not near the front is to use the 700 hPa temperatures. The figure on the left shows the 700-hPa temperature that were present at the onset of the development of convective rainfall events that produced at least 2 inches or rainfall. The majority occurred at temperatures below 12oC though a few occurred with temperatures as warm as 14oC. |
|
A air mass will usually be capped at temperatures above 12oC except in the high plains. An even better indicator of the cap is CIN (convective inhibition). Essentially, CIN is a measure of the energy needed to overcome the cap and initiate convection. When strong CIN is present along the surface the boundary and the CIN is forecast to remain strong, elevated convection may develop to the north of the surface front in the area of strong warm advection providing there is a sufficiently deep elevated unstable layer. |
|
A few ideas on forecasting elevated convection |
|
Moore et al. (2003) studied twenty-one warm season heavy rainfall events that developed north of a surface boundary. They found that the heavy-rain region of an elevated MCS is location on average about 160-km north of a quasi-stationary frontal band along a region of low level convergence that is elongated to the west (see the left hand figure below). In his composites the low-level front is located across Oklahoma and straddles the Arkansas and Missouri border. They note that large values of CIN (greater than 110 J kg-1 inhibit convection near the front. Therefore, expect elevated convection in the Plains when strong CIN is present. The exact values found by Moore are an average value for the CIN calculated in one manner and are observed CIN values. The CIN on the workstation may not be calculated in exactly the same manner and model forecast CIN may be biased. Therefore, it is important to learn any biases that may be inherent in the model forecast CIN that can be displayed on the workstation. However in general, when there is high values of CIN present along a front, convection will be capped or will develop as elevated convection on the cold side of the front. |
|
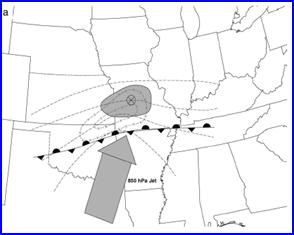
a) low-level plan view and In (a), dashed lines are representative Θe values decreasing to the north, dashed-cross lines represent 925-850-hPa moisture convergence maxima, the shaded area is a region of maximum Θe advection, the broad stippled arrow denotes the LLJ, the encircled X represents the MCS centroid location, and the front is indicated using standard notation. |
|
Adopted from Moore 2003, Schematic diagrams that summarize the typical conditions associated with warm season elevated thunderstorms attended by heavy rainfall: |
|
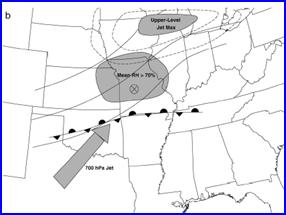
(b) middle-upper-level plan view. In (b), dashed lines are isotachs associated with the upper-level jet, solid lines are representative height lines at hPa, the stippled arrow denotes the 700-hPa jet, and the shaded area indicates where the mean surface-to-500-hPa relative humidity exceeds 70%. |
|
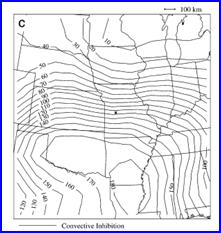
Convective inhibition (CIN) computed using the mean parcel from the lowest 100 hPa. The dot represents the MCS centroid location. |
|
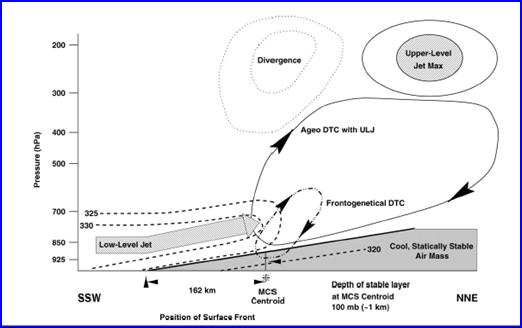
Moore and his colleagues also noted that elevated convection was more common along the right entrance region of an upper-level jet in a region of 250-hPa divergence and 850-hPa convergence. The elevated convection is also located to the north of the highest CAPE in a region where there is a strong gradient of CAPE. They presented a cross-sectional view taken parallel to the low-level jet to illustrate the typical 3-dimensional circulation pattern associated with most elevated MCSs. Note that the parcel is being lifted along an isentropic surface that is sloped with the slope largely determined by the strength of the frontal boundary and if looking at a plane view, its thermal gradient. They note that the distance north of the front is partly governed by the CAPE, CIN and slope of the isentropic surface. |
|
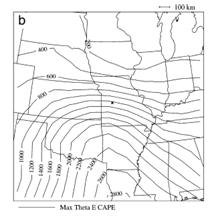
Maximum-Θe CAPE (J kg-1) computed using the parcel with the maximum Θe in the first 300-hPa of the sounding. |
|
Dashed lines represent typical Θe values, the large stippled arrow represents the ascending LLJ, the ageostrophic direct thermal circulation associated with the upper-level jet is represented by the closed solid line with the large arrows on it, the dash-dotted oval represents the direct thermal circulation associated with the low-level frontogenetical forcing. The area of aloft enclosed by dotted lines indicates the location of upper-level divergence. The enclosed solid lined area aloft is the location of the upper-level jet streak. Note the horizontal distance between the MCS and upper –level jet maximum is not to scale. |
|
Schumacher and Johnson identified that the training line-adjoining stratiform MCS that was discussed in an earlier section as the most frequent type of MCS associated with extreme rainfall. They noted that such an MCS typically was typically elevated. They note that the key to such events causing extreme rainfall is the orientation of the convective line with respect to the flow of the cloud bearing layer. When they are parallel to each other, extreme rainfall is much more likely. |
|
The saturated and climatological thickness suggested the precipitation would be well north of where the NAM was forecasting a weak surface boundary of some sort (see forecasts below) |