|
SYNOPTIC SCALE CYCLONIC CIRCULATIONS
As mentioned by Spayd and Schofield (1983), and Elsner et al, this type of excessive rainfall producer is usually associated with slow moving warm top convection. Generally, the models show a fairly strong 500 mb vorticity maximum with a very round look to it. Usually a weak surface wave develops in response to this feature. Often the convection takes on a comma shape with the heaviest rain usually occurring at the southern edge of the comma head, north of northeast of the surface low and about 2-3 degrees of latitude to the north of northeast of the 850 mb low. The squares shown on the figures below represent the typical threat area for extreme rainfall.
|
|
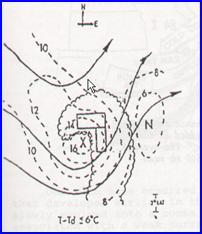
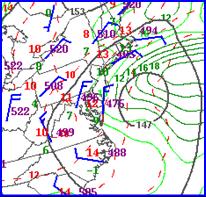
Composite of the 500-hPa vorticity for warm-top convection embedded in a synoptic-scale cyclonic circulation system. Vorticity isopleths are dashed lines, streamlines are solid lines, and low dewpoint depression areas are scalloped. |
|
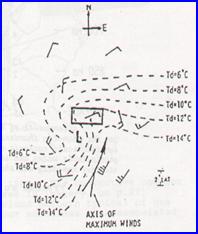
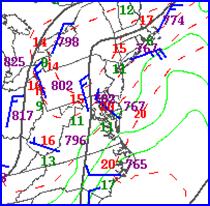
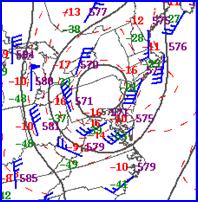
Composite of the 850-hPa chart for warm-top convection embedded in a synoptic scale circulation system. Wind barbs and dewpoint contours are annotated. |
|
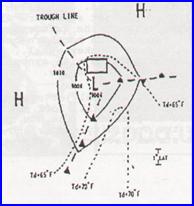
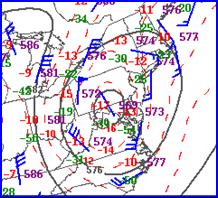
A composite of the surface chart for warm-top convection embedded in a synoptic scale circulation. Dewpoints are dashed every 5oF. Pressure is depicted by solid lines every 2 hPa. |
|
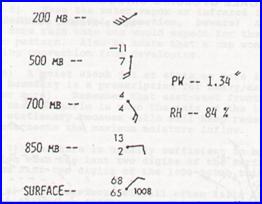
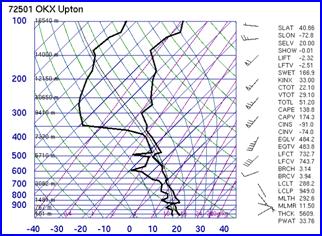
Composite of soundings for the warm-top convection embedded in a synoptic scale cyclonic circulation. The surface temperature and dewpoint is in o F, At upper levels temperatures (o C) and dewpoint depressions are given. The average precipitable water and surface to 500-hPa mean relative humidity are shown. |
|
The average precipitable water is lower for this type of heavy rainfall producing system than is typical for the various arch-types discussed by Maddox. The convection often has a much lower cloud top temperature than usually observed for most summer-season convective events. The most important characteristic of satellite cloud pattern is that it remains stationary for an extended period though it also often takes on a comma type shape. The circulation associated with these events usually extends from the surface to at least 850-hPa and sometimes to 500-hPa.
The high surface to 500-hPa relative humidity implies that the convection associated with these type systems will have low cloud bases implying the precipitation efficiency during these events is high. The axis of heavy rainfall usually occurs along a deformation zone to the north of a surface low. |
|
The case below is a good example of the rainfall associated with a cyclonic circulation system. |

|
12 UTC 12 AUG 2000 |
|
00 UTC 13 AUG 2000 |
|
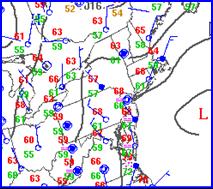
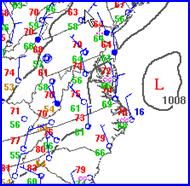
Surface maps |
|
12 UTC 12 AUG 2000 |
|
00 UTC 13 AUG 2000 |
|
925-hPa maps |


|
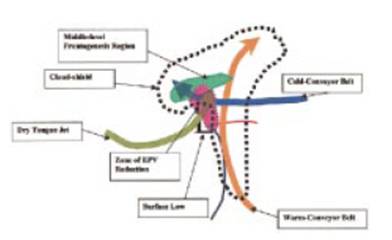
The sounding at OKX (Upton) New York exhibited a distinct easterly low-level jet of 25 knots at around 925 mb at 12 UCT 12 August and 00 UTC 13 August. Most cyclonic circulation systems that produce heavy rainfall probably are similar to winter storms that produce heavy mesoscale bands of precipitation often in the form of snow except that the area of heavy precipitation is usually smaller in scale than the winter events. Nicosia and Grumm (1999) have noted that there is a zone of differential moisture advection where mid-level drying occurred above the region dominated by the moisture laden easterly low-level jet associated with the cold conveyor belt.
where lower branch of the cold conveyor belt (in this case the easterly low level jet) |
|
The figure above is adapted from their model. They note that there is a synergistic relationship between frontogenesis and EPV reduction and differential moisture advection (Θe advection). They point out that for the two snow cases that they studied, the mesoscale bands of heavy snow occured in the zone of where the stability and EPV were being reduced and the southern edge of region of mid-level frontogenesis. The same concept holds for heavy synoptic type rainfall events except they typically occur during the warm season when airmasses are often already conditionally unstable. Therefore, the precipitation is usually a result of upright convection. |
|
Figure adapted from Nicosia and Grumm (1999) |
|
12 UTC 12 AUG 2000 |
|
00 UTC 13 AUG 2000 |
|
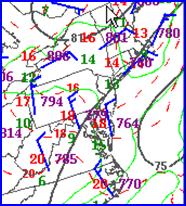
850-hPa maps |

|
Note that during this event that the 850-hPa circulation was strengthening. Such deepening of the low or mid-level circulation is typical of a cyclonic circulation system that produces heavy rainfall from thunderstorms having relatively warm cloud top temperatures. |
|
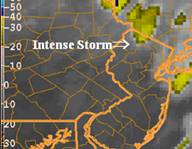
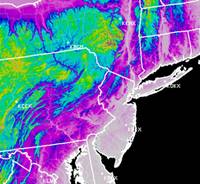
Sparta, New Jersey received 12 inches of rain during this case and several other locations in northwest New Jersey reported as much 10 inches. However, the convection did not look that impressive on the infrared imagery. Cloud top temperatures were only around –30oC fairly warm for a summer season heavy rainfall event. The equilibrium level is typically low during these type systems and for this case was at 400-hPA. |
|
12 UTC 12 AUG 2000 |
|
00 UTC 13 AUG 2000 |
|
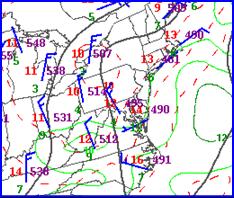
500-hPa maps |
|
Infrared image valid 1315 UTC 12 August 2000UTC |
|
Sounding valid 1200 UTC |
|
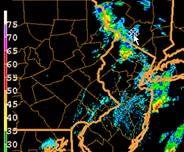
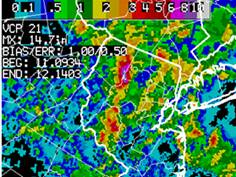
Corresponding 0.5 degree radar image |
|
Terrain map |
|
Radar rainfall estimates |
|
Slow movement of the 500-hPa circulation is another common aspect of these cyclonic circulation associated heavy rainfall events and certainly was evident for the Sparta New Jersey case (see 500-hPa maps above). Slow system movement allows the mesoscale forcing to remain relatively stationary. In the case, the axis of low level jet, frontogenesis remained relatively stationary. In this case, another big plus was lift provided by the terrain. The easterly low-level jet impinging upon the hilly terrain of northwestern New Jersey provided a stationary source of lifting. The rainfall maximum (see above) was located in northwestern NJ in proximity to the mountains. |