![[.png Graphic]
CAPEsfc [J/kg] - uvbarb2 [] at 03Z Wed 04sep1985
Size: 48 Kb](http://nomads.ncdc.noaa.gov/tmp/nomads/orders/1844/meta/IMG12911.png)
![[.png Graphic]
DPT2m [K] - uvbarb2 [] at 03Z Wed 04sep1985
Size: 46 Kb](http://nomads.ncdc.noaa.gov/tmp/nomads/orders/1844/meta/IMG10120.png)
|
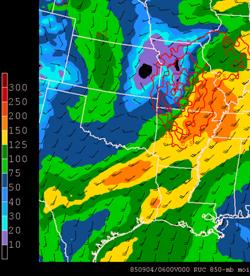
0300 UTC 4 Sept 1985 850-hPa wind and CAPE |
|
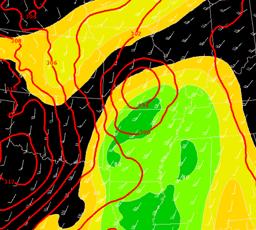
0300 UTC 4 Sept 1985 850-hPa wind and 2-m dewpoints |
|
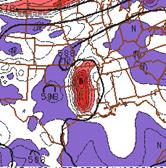
0300 UTC 4 Sept 1985 500-h and vorticity |
|
Despite the lack of convection there was reason to believe that a new outbreak might occur. In addition to having a distinct circulation apparent on the satellite imagery, there also was a fairly strong 500-hPa vorticity center apparent at 0300 UTC. A strong vorticity center even without a cold pool near the surface can produce convection. |
|
In this case there is also a cold pool associated with the remains of convection. The most unstable air is located to the southwest of this cold pool which acts to promote new cell growth on the west side of the initial convection. The basic mesoscale pattern is very similar to the one offered by Fritsch et al. in the schematic below. |
|
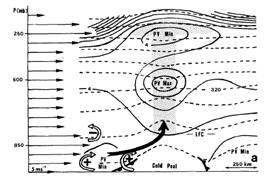
From Fritsch et al. 1994 |
|
Conceptual model of MCV that is moving slow enough that air is overtaking the system due to a low-level jet to the west or southwest. The dashed lines are potential temperature, solid lines are potential vorticity. Note that where there is rain cooled air the isentropes bulge upward and where there is warming due to latent heat the potential temperature lines bulge downward. The positive PV anomaly is located where the potential temperature gradient is greatest between the two. |
|
Isentropic lift should occur where the low level jet is forced to ascend along the isentropes associated with the cold pool. Complicating the picture is that forcing for vertical motion can also be produced by the interaction of the cyclonic vortex and PV anomaly with the ambient shear (Raymond 1992, Trier et al. 2000) and lifting can happen without a pronounced cold pool.
Schumacher and Johnson (2005) have suggested that backbuilding convection can occur from elevated pockets of convergence within a conditionally unstable layer with sufficient relative humidity to allow a moist absolutely unstable layer (MAUL) to develop. Ascent initially is produced by differential vorticity advection or vorticity advection by the thermal wind. In early stages of development ascent is produced on the downshear (downstream) side of the PV anomaly. However, with time the vortex becomes tilted because of the vertical shear. Because of the tilt that occurs due to shear, the maximum vertical displacements often shift in an anticyclonic manner toward the mid-level circulation center (Trier et al. 2000). |
|
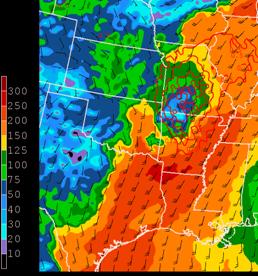
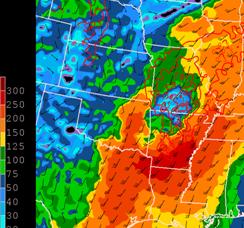
950-hPA MF (color fill), wind and 900-700 PV (red lines, contour interval=0.5 PVU) valid 0600 UTC Sept. 4, 1985 |
|
850-hPA MF (color fill), wind and 900-700 PV (red lines, contour interval=0.5 PVU) valid 0600 UTC Sept. 4, 1985 |
|
Let’s look at the 0600 UTC 4 Sept. NARR moisture flux, winds at 950-hPa and 850-hPa. One thing to note is that the low level jet during Elena was not located at 850-hPa but ascended from around 950-hPa over Texas and southern Arkansas to 850-hPa over Missouri. . |

|
The cross section below was taken along the black line on the figure above. The cross section is oriented almost parallel to the low-level jet and the time of the cross section was prior to the nocturnal outbreak of convection. Note that the cross section suggests there was a weak cold pool present where the isentropes sloped upward towards the PV maximum. This cross section is very similar to the idealized one offered by Fritsch et al. shown earlier on this page. |
|
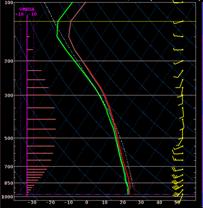
NARR 0600 UTC 925-500 hPa layer mean RH (color fill, legend at left), Θ (red lines), winds (kts) |
|
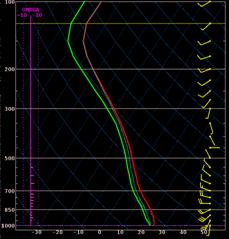
NARR 0600 UTC sounding, Cape=914, Cin=-36, PW=2.04 at 34.14oN 92.98oW. |
|
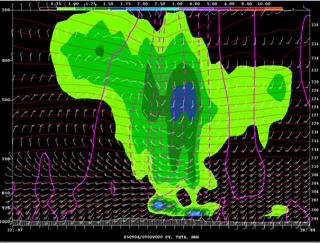
At 0600 UTC weak lifting was present to the southwest of the cold pool where the airmass was conditionally unstable and very moist. The high PW and high layer mean RH has the potential to produce a moist absolutely unstable layer if the lifting acts long enough. The combination of a decent vortex signature with strong low level jet typically produces the necessary lifting. Trier et al. have suggested that an absolutely unstable layer often develops with MCVs as parcels originate in the higher thetae air along the periphery of the vortex where there is less cloudiness and higher CAPE. These parcels are then are lifted and become saturated. Being elevated, the parcels therefore are unlikely to be impacted by the nocturnal cooling that takes place in the boundary layer along the periphery of the system where there are fewer clouds. This nocturnal cooling around the periphery of the system tends to increase the CIN around the MCS while the CIN is decreased near the system center due to the development of the MAUL. |
|
950-hPA MF (color fill), wind and 900-700 PV (red lines, contour interval=0.5 PVU) valid 0900 UTC Sept. 4, 1985 |
|
NARR 0900 UTC sounding, Cape=120, Cin=-22, PW=2.16 at 34.7oN 92.44oW. |
|
The 0900 UTC NARR f00 sounding shows a saturated layer just above 700-hPa that looks like it might a weak MAUL. By this time, the nocturnal convection had developed. Operational model soundings may have a hard time forecasting a true moist absolutely unstable layer depending on its convection scheme. For example, the BMJ reference profiles make it hard to get a saturated layer if the scheme is activated.
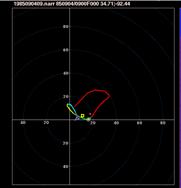
Schumacher (personal communication) has suggested that a hodograph has a very distinctive look most times when an MCV develops new convection near the center. The part of the hodograph that represents the low levels has the look of the top of a coat-hanger. |
|
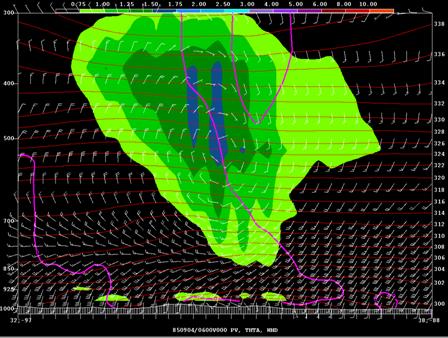
0600 UTC 4 Sept cross section showing PV (color filled, interval=0.50 PVA), potential temperature (red lines, interval=2oK), omega (cyan lines). Upward motion is negative and at 0600 UTC was very weak. |
|
NARR 0900 UTC hodograph |
|
0900 UTC 4 Sept cross section showing PV (color filled, interval=0.50 PVA), potential temperature (red lines, interval=2oK), omega (cyan lines). Upward motion is negative and at 0600 UTC was very weak. |
|
Elena Continued |