|
MCS movement exercise 2 |
|
Use the following maps and forecast soundings to :
1) decide which Parker et al. archtype of MCS to predict: 2) to forecast the MCS’s movement using the appropriate vector method 3) Decide whether to increase or decrease the precipitation that the models are forecasting with the system.
|
|
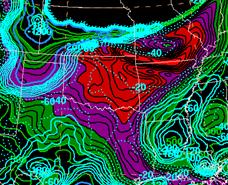
NAM 2100 UTC CAPE and CIN forecast |
|
NAM 0000 UTC CAPE and CIN forecast |
|
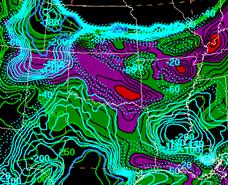
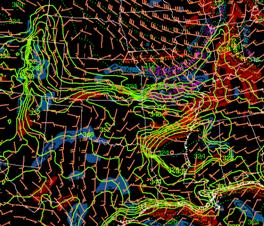
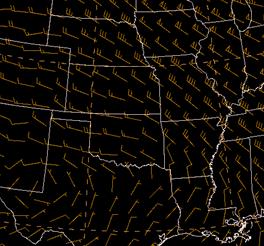
NAM 2100 UTC 850-hPa wind, Øe and Øe advection forecast |
|
NAM 0000 UTC 850-hPa wind, Øe and Øe advection forecast |
|
Double click the left button to play. To view the last image of the sequence, pull the drag bar all the way to the right. The loops plays from 1215UTC to 0015 UTC |
|
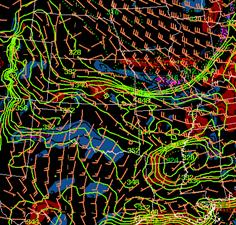
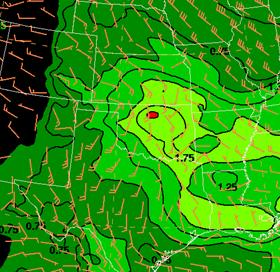
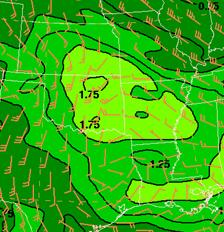
NAM 0300 UTC 850-hPa wind and total precipitable water forecast advection forecast |
|
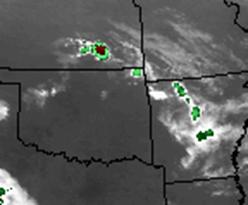
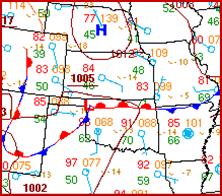
It’s very unstable along and south of the front with 3000-4000 J/kg CAPE across Oklahoma. The loop below shows an infrared satellite loop for the area of concern. |
|
Where the convection first develops is often important in determining the archtype of convection that develop. Based on the satellite loop along with the other charts think of some questions that you should ask when trying to forecast where the first convection might fire?
|
|
Concerning convection initiation , which statement is the least likely to be true. |
|
B) The high forecast CAPE and precipitable water values suggest convection will first form south of the analyzed front. |
|
A) A good place for convection to develop is just north of the 850-hPa Øe ridge in the southern portion of the region of Øe advection. |
|
C) The axis from southeastern Kansas to Arkansas might be more favored than northeastern Oklahoma for initiation |
|
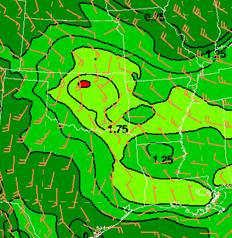
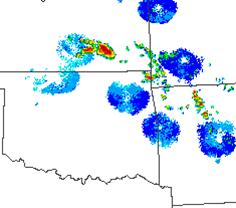
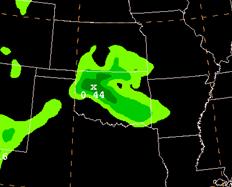
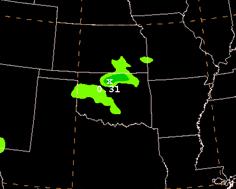
0230 UTC radar |
|
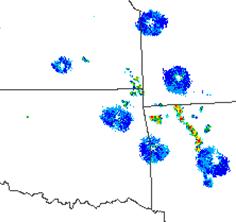
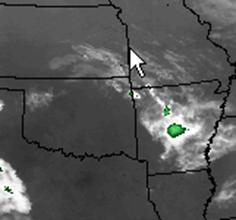
0215 UTC Infrared imagery |
|
0315 UTC Infrared imagery |
|
0330 UTC radar |
|
The first convection develops over across southeast Kansas and Arkansas along and north of the boundary. Once you’ve determined where the convection will start, the next step is to determine what type of system will develop. |
|
NAM 0300 UTC 850-hPa wind and total precipitable water forecast advection forecast. |
|
NAM 0600 UTC 850-hPa wind and total precipitable water forecast advection forecast. |
|
NAM 0300 UTC 850-hPa wind, Øe advection and moisture convergence forecast |
|
NAM 0600 UTC 850-hPa wind, Øe advection and moisture convergence forecast |
|
Note where the initial convection broke out in Kansas on the 0315 UTC and 0330 UTC imagery above and then look at the forecasts of precipitable water and 850-hPA winds. One clue to where the first convection might occur was the apparent development of altocumulus clouds or cumulus clouds over southeastern Kansas.
Note the location of the axis of the low-level jet compared to the initial convection. Where does the axis of low level jet impinge upon the frontal zone, is it east or west of the initial convection? |
|
From the forecast fields above which MCS type do you think is more likely. |
|
A) A forward propagating MCS |
|
B) A training line-adjoining stratiform MCS |
|
C) A parallel stratiform system |
|
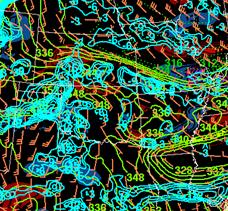
NAM 0300 UTC 850-300 hPa mean wind forecast |
|
Which of the two Corfidi techniques will probably work best? |
|
A) The original CMF method |
|
B) The revised technique |
|
Valid 0300 UTC
|
|
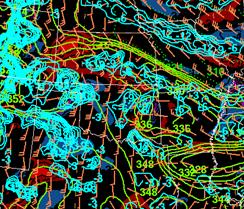
Valid 0600 UTC
|
|
The NAM forecast of the maximum precipitation is obviously going to be too far southwest and it will also be too light. |
|
To see what actually happened. Click here. |