|
Terrain and resolution issues |


|
The two graphics above are the new GFS terrain. Note that it now clearly defines such terrain features as the Sacramento Valley and Columbia river valley of the Cascade range in Oregon and Washington and the Hudson Valley.
The GFS uses a mean terrain. The Mountain tops in the models are lower than the true terrain and valleys are often higher. highest terrain in the Rockies is nearly 5000m but the height in the smoothed model terrain is only 3500m. The Appalachians are depicted as being between 800-1050m in the smoothed mean average model terrain but the highest terrain is actually between 1000-2000m. The figure below is an idealized example of how the differences between actual terrain and model terrain might impact on a quantitative precipitation forecast. |

|
Precipitation in complex terrain is often strongly tied to terrain and orographic lifting. Precipitation is enhanced on the upwind side of the mountains while there is often a rain shadow on the downwind side. In illustration above, grid point 1 would not be impacted by down-sloping winds but a town in the valley (point A) would probably would and would probably receive less rain or snow than forecast by the model. For the ski resort at point B, the snowfall would be heavier than predicted at the nearest model point (2). You can also imagine how the mean terrain can deleterious effect on a low level temperature forecast for valley and mountain locations.
The GFS forecast (below right) is about as good as you can expect from a model with the mean model terrain and a resolution of about 40 km. |

|
Observed 24 hour precipitation ending 1200 UTC 7 Nov. 2006 |

|
Legend in mm |

|
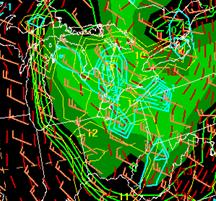
12-36 hr GFS QPF valid 1200 UTC 7 Nov. 2006 |


|
PRISM yearly rainfall climatology (left) and legend |
|
The model did a good job of predicting that the event would be a heavy one and did a good job of forecasting the generally area where the heaviest rainfall would be located. However, the model did not forecast heavy enough rainfall maxima over the coastal mountains or over the Cascade range. Note that the location of the observed precipitation maxima along the Oregon and Washington coast were very similar to the maxima on the PRISM climatology. The model did not adequately depict the rain shadow to the east of the Cascades or depict the break in heavier rainfall between the Blues of southeastern Washington/northeastern Oregon and the higher terrain of Idaho. |
|
The GFS also lacks to explicitly predict the convective plumes associated with lakes effect events. Note the radar echoes to the lee of the southern part of Lake Michigan compared to where the GFS is predicting However, the increase from a T-170 (approximately the resolution of a model with 80-km grid spacing) to T-382 (roughly the resolution as a model with a 40-km grid) now allows it to at least forecast enhanced low-level lifting to the lee of the lakes. |

|
Observed radar composite valid 0000 UTC 9 Dec 2006 |
|
12-hr GFS forecast valid 0000 UTC 9 Dec 2006 of delta T between 2-m and 850-hPa, wind in the lowest 30-hPa, RH in the 60-90 hPa above ground layer and omega in the 150-180-hPa above ground layer. |