|
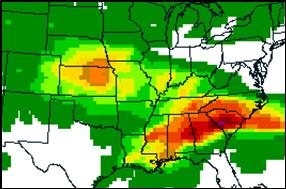
36-60 hr GFS accumulated precipitation valid 1200 UTC 21 March 2006 (in mm) |
|
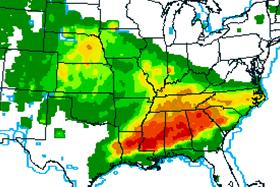
24 hr observed rainfall (in mm) ending at 1200 UTC 21 March 2006 |
|
The observed and forecast maps above illustrate the typical bias of the GFS. Note that across the Kansas near where the upper low would be located that the model predicted a an area of 25 mm (1.00”) or greater precipitation compared to the much smaller area that was observed. Some of the difference may be due to problems measuring snow which is not captured well by ASOS, however most of the observed bias probably is related to the model overprediction as it suffers from the same bias during much of the year. Farther south the model did a decent job of forecast the size of the areal coverage of the 25 mm or greater amounts. However, the model predicted its maximum well downstream (east-northeast) of where the axis of heaviest rainfall was observed.
The UCAR Model Matrix discussion notes that grid-scale precipitation bulls-eyes result from insufficient model convection. The discussion notes that these bulls-eyes typically develop later than when convection should actually develop. Therefore, these maxima often occur over the sloping frontal surface or downstream from where the convection actually occurs which is near the front in or near the warm sector.
|
|
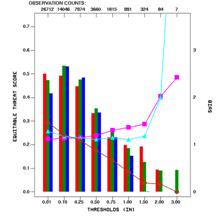
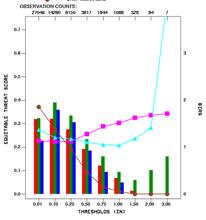
The bias is much higher over the Midwest region than the gulf coast region form almost all thresholds and time ranges. The GFS appears to have high bias across the northern states and a low bias for heavier amounts across the south, especially at the longer time ranges. A subjective verification of the GFS during the March-June 2006 period by Faye Barthold found that during 45 percent of the GFS forecasts of rainfall maxima east of the Rockies that the GFS predicted the maximum too far north and made a had fairly accurate prediction of the maximum 34 percent of the time. Only 6 percent of the time was the maximum too far south. When strong shortwaves are present, the GFS tends to predict too much precipitation with the upper low or upper trough and too little precipitation ahead of the trailing cold front across the southern states. The same bias was present during the fall of 2006. |
|
12-36 hr scores over Midwest Region for Region for 3 month period Sept-Nov |
|
60-84 hr scores over Midwest Region for Region for 3 month period Sept-Nov |
|
The GEFS ensemble members currently use the same simple cloud scheme as the GFS and also a simplified version of the Arakawa-Schubert Convective parameterization scheme. This suggests that un-bias corrected or calibrated members are liable to have the same performance characteristics as the GFS. If true, using it to help assess where to predict the axis of heavy rainfall may be problematical. It’s also important to realize that the A/S scheme will not accurately simulate outflow boundaries. This is another source of possible error. |
|
A grid-scale feedback bomb |
|
Under-development |
|
GFS model performance at predicting QPF (continued) |