|
Another case...using ensemble guidance and standardized anomalies. |
|
Standardized anomalies are a useful but not a stand-alone forecast tool. They should be used as and adjunct to an ingredients based approach to assessing the pattern and its precipitation potential and that many heavy rainfall events are associated with convection and mesoscale and storm scale processes. A number of factors that should be considered when trying to forecast extreme rainfall are discussed elsewhere http://www.hpc.ncep.noaa.gov/research/mcs_web_test_test.htm.
First we’ll use the forecast funnel approach espoused by Snellman (1977) and look at the synoptic scale pattern and then work towards assessing the systems potential to produce a mesoscale heavy rainfall event. |
|
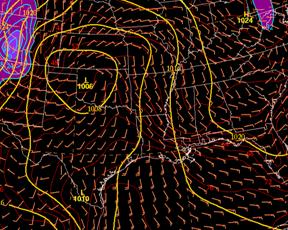
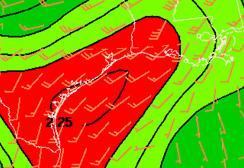
12 hr NAM surface pressure and boundary layer wind and temperature v.t. 1200 UTC Oct. 26, 2006. The thick red lines is a warm frontal position. |
|
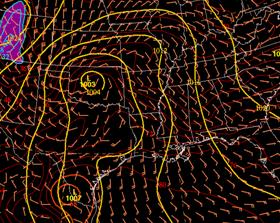
24 hr NAM surface pressure and boundary layer wind and temperature v.t. 0000 UTC Oct. 27, 2006. The thick red lines is a warm frontal position. |
|
A fairly cold airmass was located over the east and the NAM and GFS predicted the development of a low to the lee of the Rocky Mountains in western Oklahoma. The remains of an old frontal boundary was located over Louisiana. This boundary was predicted to move very little during the 12 hours between the two forecast maps shown above. South of the warm front, surface dewpoints were forecast to be above 70oF to the south of the warm front across eastern Texas and over the western Gulf of Mexico. |
|
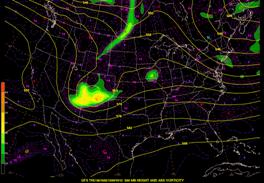
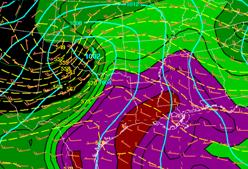
12hr GFS 500-hPa heights and vorticity valid 1200 UTC 26 Oct 2006. |
|
588 |
|
576 |
|
564 |
|
588 |
|
576 |
|
564 |
|
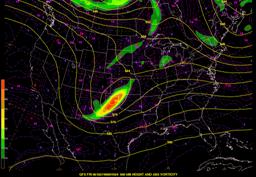
27hr GFS 500-hPa heights and vorticity valid 0300 UTC 27 Oct 2006. |
|
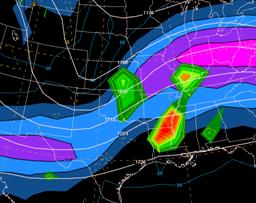
27hr GFS 250 heights and isotachs valid 0300 UTC 27 Oct 2006. |
|
The first question to ask is this a synoptic or mesoscale pattern that you recognize as one favorable for heavy rainfall. In this case the synoptic pattern looks very similar to the Maddox et al. synoptic type heavy rainfall archtype. A front is approaching eastern Texas and Louisiana with very moist and relatively unstable air located across eastern Texas to its east. |
|
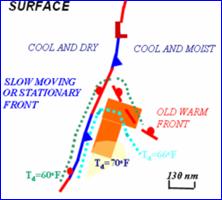
Schematic diagram of surface pattern for Maddox et al. (1979) heavy rainfall events. |
|
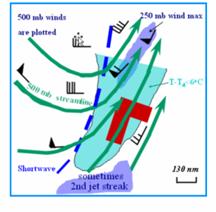
Schematic diagram of upper level pattern during Maddox et al. synoptic type events. Green lines are 500-hPa streamlines, winds are at 500-hPA, light blue is location of 250-hPa wind maxima. |
|
The next step of the forecast process is to start an ingredients based diagnoses of the rainfall potential. |
|
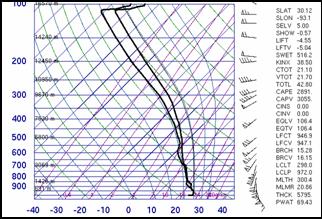
Sounding at 1200 UTC 16 Oct. 2006 for Lake Charles, Louisiana. |
|
Remember that rainfall rates are determined by the vertical transport of moisture into the cloud system and on the precipitation efficiency. The single most important factor in precipitation efficiency is the relative humidity. In this case, the airmass is unstable with sufficient CAPE to support fairly strong updrafts. |
|
The positive area of the sounding is long and skinny rather than short and fat. There is very deep layer near saturation with around a 4 km above freezing layer which is favorable for warm rain processes and high precipitation efficiency. Note also that the forecast 850 winds at LCH below are considerably lighter than forecast by the GFS but that the precipitable water forecast is similar in magnitude. |
|
12 hr GFS 850-hPa wind and PW forecast valid at 1200 UCT 16 Oct. 2006. Black dot is location of LCH. |
|
24 hr NAM PMSL, PW and original CMF (Corfidi) vectors valid 0000 UTC 17 Oct. 2006. Barb=10 kts, half barb=5 kts. |
|
Analysis of the observed and forecast soundings (not shown) suggested the potential for high rainfall rates. The CMF vector method (above right) suggested that any convective system would be slow moving, in the 5 to 10 kt range. Clearly, the pattern favors heavy rainfall somewhere across the south. |
|
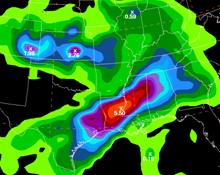
12-36 hr GFS QPF valid 1200 UTC 17 Oct. 2006. |
|
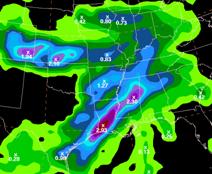
12-36 hr NAM QPF valid 1200 UTC 17 Oct. 2006. |
|
That both the GFS and NAM forecast heavy rainfall across the region from eastern Texas across Louisiana into Texas is no surprise. In a sense, the two forecasts provide two members of an ensemble. Ensemble products provide an estimate of the uncertainty of the event and can provide a rough idea of the probability of an event occurring. In this case, the operational models indicated there is a high likelihood of a heavy rainfall event but differ on how heavy and where the maximum might be located. Ensemble forecasts from the SREF and GEFS are additional tools that can and should be used to assess the likelihood of this being a significant rainfall event. |
|
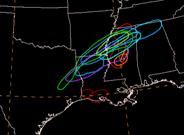
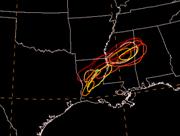
24 hr 3 inch spaghetti diagrams valid 1200 UTC 17 Oct. 2006 |
|
SREF members, eta members are red/yellow, rsm members are blue/purple and wrf members are green. |
|
GEFS members, only initial conditions are perturbed. |
|
Based on the two sets of ensemble products and your knowledge of the GEFS and SREF ensemble guidance which is the least true. |
|
The ensembles members suggest that the NAM maximum rainfall may be too light. |
|
The ensemble members suggest that the highest threat for over 3-inches of rain extends along an axis from central and northern Louisiana into central or northern Mississippi. |
|
The SREF ensemble members will typically show more spread than the GEFS members. |
|
The ensemble members suggest there is a high probability of over 3 inches during the event and that there is some potential for over 5 inches. |