Whenever the models are forecasting the number of standard deviations to be 3 units of more from climatology, a significant or record breaking event is being suggested. By looking through some of the significant events listed in the menu, you will notice that these events are typically 3-4 standard deviations from normal during the cold season and 2-3 in the warm season. Forecast values of 5 and 6 are of extremely low probability and should be closely scrutinized if displayed in model forecast data. The climatological standard deviations are not as great over the southern latitudes, particularly during the warm season, because the probability of the heights and temperatures do not follow a normal distribution. So since heights or temperatures are more likely to exceed 1 standard deviation at lower latitudes, the deviation numbers in the NTRANS product will often be higher in these areas.
For example, if the average 500 hPa height for July 4 over Atlanta, GA is 588 dm, and the standard deviation for 500 hPa height over Atlanta is 3 dm, a forecast value of 3 standard deviations from normal or -3 would suggest a forecast height of 579 dm which is 9 dm below climatology.
Taking a look a Seattle, WA for July 4, the average 500 hPa height is about 570 dm, and the standard deviation for 500 hPa height over Seattle is 9 dm. That means a forecast value of 3 standard deviations from normal or -3 would suggest a forecast height of 543 dm or 27 dm below climatology.
When in doubt on shift, it may prove beneficial
to compare the model forecast heights with the standard
deviations found on this page to get a better idea of the history
of the pending event.
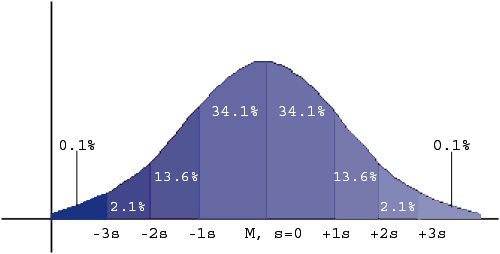
Below is a chart depicting the probability
of occurence of the number of standard
deviations from climatology based on a standard probability density function (PDF) curve. The values show the probability of an event being a specific number of standard deviations from the climatological mean. The values include both above and below normal conditions.
| # of Standard Deviations | Probability of Occurence Based on Climatology |
| 1s | 0.6826895 |
| 2s | 0.2718076 |
| 3s | 0.0428032 |
| 4s | 0.0026364 |
| 5s | 0.0000628 |
The values plotted on the standard "bell curve" depict percent probability of a standard deviation being above or below the climatological mean (essentially these values are half of the probabilites sited in the above chart). As you can see, there is extremely low probability for forecast events greater than 3 standard deviations from climatology.
An example of an event where 500 hPa heigths were 4 standard deviations below the 50 year climatology is the October 1996 snow event in the Kansas City area.