|
|
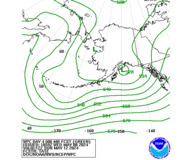
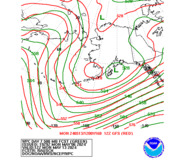
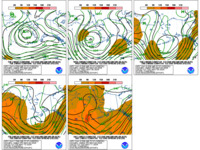
WPC's Day 4-8 Alaskan 500mb Height Forecasts
The images below represent 500mb height forecasts utilizing the latest operational models and/or
ensemble guidance.
|
WPC Forecast
|
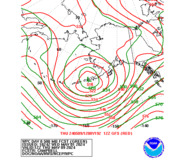
WPC vs GFS
|
WPC vs Ensemble Mean
& Spread
|
|
|
| Information regarding preferred models and forecaster confidence
in the preparation of this forecast can be found in the following product:
|
|
WPC 500mb Graphics Description
|
| |
|
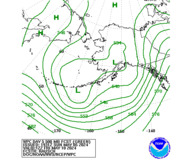
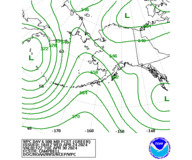
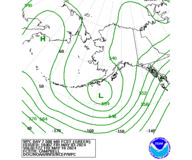
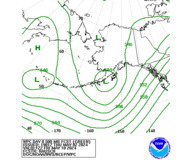
The following images represent WPC's forecast.
Day 4
|
Day 5
|
Day 6
|
Day 7
|
Day 8
|
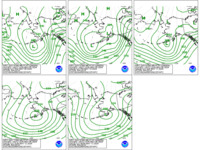
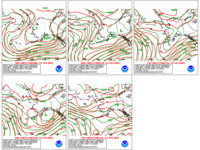
Days 4 to 8
|
 Loop of WPC's forecasts from days 4-8.
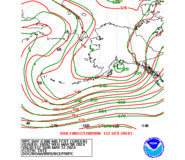
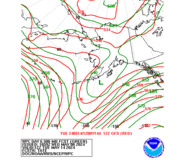
Comparison between the 00Z or 12Z GFS
(in red) and WPC's forecast.
Day 4
|
Day 5
|
Day 6
|
Day 7
|
Day 8
|
Days 4 to 8
|
Loop of WPC's forecast versus the 00Z or 12Z GFS from days 4-8.
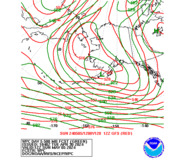
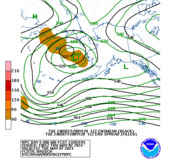
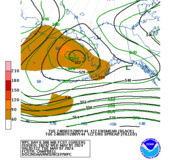
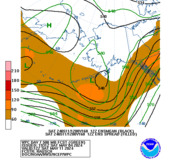
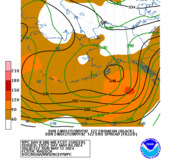
Comparison between the 00Z or 12Z GFS Ensemble Mean (in black) and WPC's forecast. The shaded regions represent
the spread (in meters) of the ensemble forecasts.
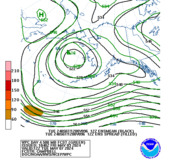
Day 4
|
Day 5
|
Day 6
|
Day 7
|
Day 8
|
Days 4 to 8
|
Loop of WPC forecast/Ensemble Mean and
Spread for days 4-8.
|