Quantitative Precipitation Forecasts (QPFs)WPC QPF Program Overview Webinar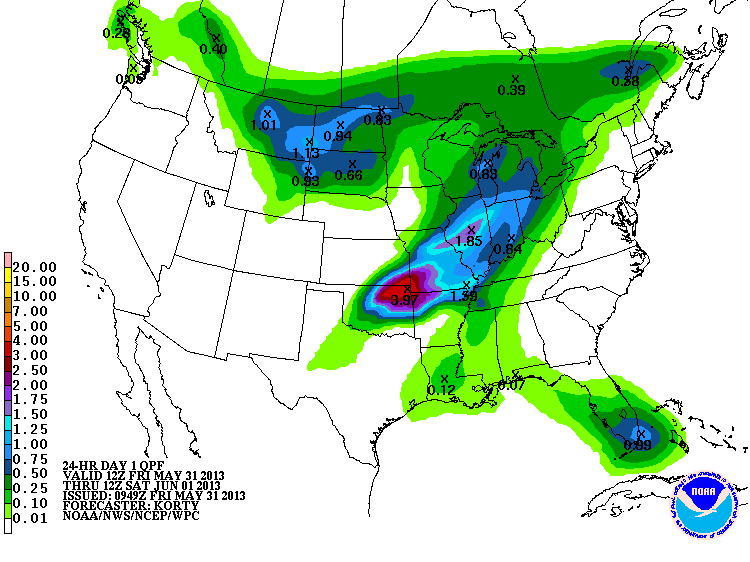
Forecasters at the WPC and its predecessor organizations have been making Quantitative Precipitation Forecasts since 1960. Quantitative Precipitation Forecasts, or QPFs, depict the amount of liquid precipitation expected to fall in a defined period of time. In the case of snow or ice, QPF represents the amount of liquid that will be measured when the precipitation is melted. Precipitation amounts can vary significantly over short distances, especially when thunderstorms occur, and for this reason QPFs issued by the WPC are defined as the expected "areal average" (on a 20 x 20 km grid) in inches. Methods for producing QPFs are similar to other meteorological forecasts. First, meteorologists analyze the current state of the atmosphere. Then they use model forecasts of pressure systems, fronts, jet stream intensity, etc., to form a conceptual model of how the weather will evolve. The WPC has unique access to the full suite of operational and ensemble model guidance from modeling centers in the U.S., Canada, and Europe (the foreign models are global models, so they also make predictions over the U.S.). The WPC also stores output from several consecutive runs of all of these models, allowing for trend analysis of model QPFs. Forecasters determine which models are showing a reasonable amount of precipitation in roughly the correct place and time. Those choices serve as the starting point for QPFs, but forecasters also make manual adjustments based on their experience. WPC forecasters often engage in discussion with some of the 122 local National Weather Service Forecast Offices, 12 River Forecast Centers, and other national centers such as the Storm Prediction Center and National Hurricane Center. In fact, per a 2005 agreement, the WPC provides the rainfall forecast (known as a rainfall statement) that the National Hurricane Center inserts into each tropical cyclone advisory it issues. The WPC is also co-located with NOAA's National Environmental Satellite, Data, and Information Services (NESDIS) Synoptic Analysis Branch (SAB). The SAB provides information on satellite trends which helps refine short range QPFs. Together, the SAB and Day 1 QPF desk at the WPC are known as the National Precipitation Prediction Unit (NPPU). This collaborative process makes WPC forecasts generally more accurae than any individual model, and consecutive versions of WPC forecasts do not differ as much as consecutive model forecasts sometimes do. Technical Description of QPFs: The QPF contours (isohyets) are drawn to encompass areal average amounts of 0.01, 0.25 inch, 0.50 inch, 1 inch, 1.50 inches, and 2.00 inches. Any values greater than 2.00 inches are drawn in one-inch increments. In addition, the location of QPF maxima are indicated on the chart by an "X", with the associated maximum value printed underneath. It is important to note the valid time period when viewing each product. Specifically, for the Day 1, 2, and 3 forecasts, QPFs are manually created for 6-hour periods and an accumulated 24-hour total QPF is also issued. For the Days 4/5 and Day 6/7 QPF, forecasters manually create a 48-hour accumulation of areal average rainfall. Computer programs then take advantage of model forecasts of the timing of precipitation to break the WPC forecast down into 6-hourly QPFs. Forecasts issued on the day shift correspond to periods ending at 0000Z (for issuance times between 1800Z and 2030Z), and those issued on the night shift correspond to periods ending at 1200Z (for issuance times between 0600Z and 0830Z). Multi-day Accumulation Products: Through simple addition of the various 24-hour and 48-hour QPFs, WPC is able to provide multi-day accumulation forecasts. Days 1-3, Days 1-5, and Days 1-7 accumulations are made available, and can be powerful planning tools for many applications. Schedule of QPF Issuance:
* Forecasts made on the night shifts are verified versus observed rainfall. The valid time of 1200z to 1200z for QPFs issued by the night shift coincides with the 24-hour observation cycle for National Weather Service Cooperative Observers and many other rainfall networks such as CoCoRaHS. All Times shown are in Zulu (Z), or Greenwich Mean Time, and correspond to the time in Greenwich, England, as seen on a 24-hour clock.
Excessive Rainfall Outlooks
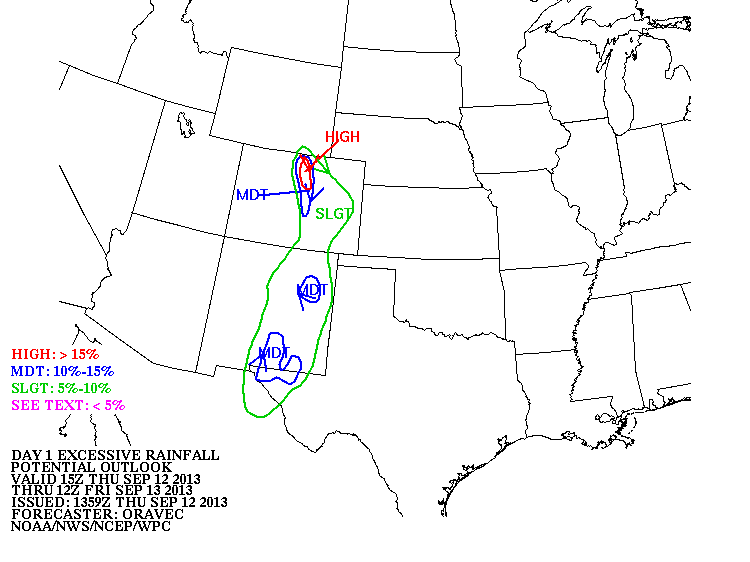
In the Excessive Rainfall Outlooks, the Weather Prediction Center (WPC) forecasts the probability that rainfall will exceed flash flood guidance at a point. Gridded FFG is provided by the twelve NWS River Forecast Centers (RFCs) whose service areas cover the lower 48 states. WPC creates a national mosaic of FFG, whose 1, 3, and 6-hour values represent the amount of rainfall over those short durations which it is estimated would bring rivers and streams up to bankfull conditions. WPC estimates the likelihood that FFG will be exceeded by assessing environmental conditions (e.g. moisture content and steering winds), recognizing weather patterns commonly associated with heavy rainfall, and using a variety of deterministic and ensemble-based numerical model tools. The risk of excessive rainfall is expressed both probabilistically and categorically according to the table below.
Flash floods are rare events at any one specific location, and, therefore, the point probability of a flash flood is low even when forecasters are confident that flash flooding will occur within the region. When forecasters declare risk areas by placing a contour on an Excessive Rainfall Graphic they are expecting at least some flash flooding to occur, and the possibility of very organized heavy rainfall and flash flooding affecting numerous locations. In an ideal case, as confidence of the threat increases (usually as lead time decreases) the category may be updated from Slight to Moderate to High. In other cases, risk areas may be introduced quite suddenly and with short lead time, owing to the difficult nature of flash flood forecasting. On the Excessive Rainfall Outlook graphics a closed contour with an arrowhead delineates the probability forecasts, with risk areas defined to the right of the direction of the arrowhead. If the potential exists for excessive rainfall, but the expected probability for a point location is less than 5%, WPC will place the words SEE TEXT over the threat area. This area will then be referenced in the Excessive Rainfall Discussion. The SEE TEXT label is only used on the Day 1 Outlooks. If conditions are not expected to become favorable for flash flooding anywhere in the lower 48 states then text across the center of the graphic will read, "NO ORGANIZED AREAS OF RAINFALL EXCEEDING FLASH FLOOD GUIDANCE ARE EXPECTED." WPC produces Excessive Rainfall Outlooks for Days 1, 2, and 3. Outlooks for Days 2 and 3 differ from those issued for Day 1 in the following ways:
Note that FFG may be difficult to apply to a Day 2 or Day 3 forecast (or even late in Day 1 if it is already raining). Forecasters must make an educated guess as to how FFG will change in response to exiting precipitation systems (FFG recovery) or incoming precipitation systems (lowering of FFG). Increased variability in model guidance and the inability of the models to resolve mesoscale features results in greater uncertainty in forecasting excessive rainfall for the day 2 and day 3 periods. The product definition, "probability of rainfall exceeding flash flood guidance," does represent our best attempt to forecast flash flooding from heavy rainfall, which is almost always driven by convective rain rates. Some events, however, do border on (or transition to) inundation flooding or main stem river flooding occurring when the causative rain event is of longer than a 6-hour duration and/or is not especially heavy. Forecasts of main stem river flooding are made by the RFCs out to 5 days lead time, and are packaged by WPC into a national mosaic in the Flood Outlook Product. Schedule of Excessive Rainfall Outlook Issuance: Day 1 Excessive Rainfall Outlooks (graphic and associated discussion) have scheduled issuances three times per day: 01, 09, and 15 UTC. Day-2 and Day-3 versions are issued twice daily. The valid times varies as noted in the table below. Unscheduled, event-driven updates may be issued as needed.
National Weather Service forecast discussions have been used for decades to summarize our assessment of the upcoming weather pattern and associated impacts. Discussions are also used to convey the forecasters' confidence in both the available model output and the manual forecast. Schedule of QPF Discussion (QPFPFD) Issuance:
* Days 4/5 and 6/7 QPFs are produced by the WPC medium range desk which issues a medium range forecast discussion (PMDEPD). Text-based coding of the 24-hour QPF contours Included at the end of the QPF Discussion for Days 1-3 is a bulletin that describes the shape of the forecast isohyets using latitude and longitude pairs. The order in which the pairs appear is important as this gives the contour or isohyet a clockwise direction as the points are plottd to create the contour. The forecast value associated with a given isohyet is valid in the enclosed area to the right of the direction in which the contour is drawn. The 0.50" contour described in the example below would represent an areal average of 0.50" forecast over parts of northwestern Colorado and southern Wyoming.
Example: The first field is the value of the contour; in this case the values are 0.25" or 0.50". The following fields are the latitude/longitude pairs for the contour. The first three digits of the pair are the degrees of latitude (in tenths of degrees North latitude). The last three digits of the pair are the degrees of longitude (in tenths of degrees West longitude). If the fourth digit is less than 5, a leading "1" is added to indiate longitudes greater than or equal to 100oW. From the above message, the following table gives the decoded lat/lon pairs: | ||||||||||||||||||||||||||||||||||||||||||||||||||||||||||||||||||||||||||||||||||||||||||||||||||||||||||||||||||||||||||||||||||||||||||||