| WPC Met Watch |
|
|
Mesoscale Precipitation Discussion: #0248 |
|
(Issued at 200 AM EDT Sat May 10 2025
) |
|
| MPD Selection |
|
|
|
|
|

Mesoscale Precipitation Discussion 0248
NWS Weather Prediction Center College Park MD
200 AM EDT Sat May 10 2025

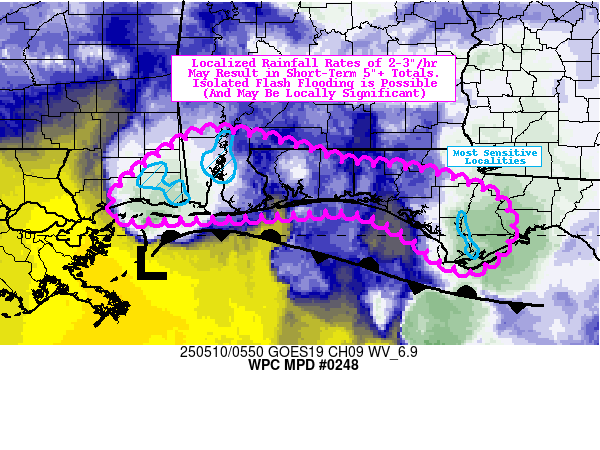
Areas affected...portions of far southern AL/MS into the FL
Panhandle

Concerning...Heavy rainfall...Flash flooding possible

Valid 100600Z - 101200Z

Summary...Localized rainfall rates of up to 2-3"/hr may result in
short-term totals of 5"+ through 7am CDT. Isolated instances of
flash flooding are possible (and could be locally significant over
more sensitive low-lying and metro areas).

Discussion...A deep layer (surface to 500 mb) vertically tilted
cut-off low is becoming more convectively active over the past few
hours near the low-level (surface to 850 mb) center (just offshore
southeast LA and southern MS). GOES-East infrared imagery depicts
cooling cloud tops in association with this recent deep
convection, though a rainband farther east (within the core of the
warm conveyor belt) has maintained more impressive cold cloud tops
with occasional overshooting tops. Both areas of convection are
only just beginning to come ashore, though lapse rates remain
unimpressive both in the vicinity of the convection and well
onshore of both areas (max 2-6 km lapse rates of less than 7deg
C/km). That said, a corridor of increasing instability (+300-600
J/kg) is evident over the past several hours in association with
the convection near the core of the low-level center (with little
change so far in instability farther east into the FL Panhandle).
CIRA composite advected layer precipitable water (PWAT) imagery
depicts a clear increase in low-level PWAT (sfc-850 mb and 850-700
mb layers), pivoting around the center of the low-level
circulation (with both NEXRAD VWP and GOES Derived Motion Wind
Vectors (DMW) indicating 15-25 kt flow around a well-defined
surface circulation from an ideally placed ~330z ASCAT pass).
Total PWATs range from 1.7-1.9 inches (between the 90th percentile
and max moving average, per LIX sounding climatology), and
low-level moisture transport and convergence (isentropically
ascending) is also being complemented by upper-level diffluence
(also evident in NEXRAD VWP and GOES DMW between 400-250 mb) with
deep layer (0-6 km) shear of 30-50 kts.

The latest hi-res guidance (00z HREF suite, 18z REFS suite, and
more recent runs of both the HRRR and RRFS) generally indicates
the potential for extreme localized rainfall rates (2-3"/hr) with
resulting isolated totals of 3-6"+ through 12z. The spatial
disparities in these high QPF totals are relatively wide, but have
come into better agreement (with 00z guidance onward) in depicting
the greatest potential for localized 5"+ totals in the vicinity of
the low-level center (confined to far southern portions of MS/AL,
possibly extending into the far western FL Panhandle). This is
consistent with the most recent observational trends, and 00z HREF
40-km exceedance probabilities for 5" are indicated to be as high
as 10-20% (with corresponding 100-yr ARI exceedance probabilities
of 5%). Given the high uncertainty in the manifestation of these
localized extreme rainfall rates/totals (which are largely
conditionally dependent on localized backbuilding of convection
near the low center), isolated instances of flash flooding are
considered to be possible. Given the proximity to relatively
sensitive low-lying and urbanized metropolitan areas (with 3-6
hour Flash Flood Guidance as low as 1.5-2.0"), locally significant
flash flooding is also possible.

Churchill

ATTN...WFO...LIX...MOB...TAE...

ATTN...RFC...LMRFC...SERFC...NWC...

LAT...LON   31188815 31148755 31018700 30838646 30788588
            30688535 30578502 30398468 30088453 29828468
            29588498 29708537 30048582 30268632 30278684
            30238745 30238749 30198859 30228915 30548913
            30878871
Download in GIS format: Shapefile
| KML
Last Updated: 203 AM EDT Sat May 10 2025
|


