| WPC Met Watch |
|
|
Mesoscale Precipitation Discussion: #0366 |
|
(Issued at 1259 AM EDT Thu Jun 05 2025
) |
|
| MPD Selection |
|
|
|
|
|

Mesoscale Precipitation Discussion 0366
NWS Weather Prediction Center College Park MD
1259 AM EDT Thu Jun 05 2025

Areas affected...Southeast MO...Southern IL..Southwest to Central
IND...Adj KY...

Concerning...Heavy rainfall...Flash flooding possible

Valid 050500Z - 051030Z

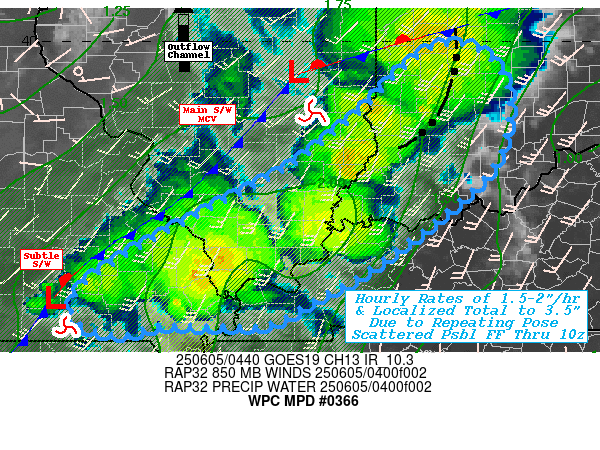
SUMMARY...Increasing convective efficiency with clusters.
Favorable orientation may allow for multiple repeating rounds
resulting in widely scattered incidents of 2.5-3.5" totals and
possible localized flash flooding.

DISCUSSION...GOES-E WV along with RADAR mosaic denotes well
defined shortwave/MCV crossing SE IL into west-central IND, with
excellent anticyclonic outflow channeling to maintain MCV strength
and therefore low level inflow.  WV suite and RAP analysis also
shows another subtle upstream shortwave, weak feature that can be
seen in 850mb vorticity analysis near the MO Bootheel in Northern
AR, moving even slower northeast.   850mb flow analysis shows
return moisture channel across the TN Valley becoming
convergence/confluent through the Tri-Rivers area of W KY
intersecting with the frontal zone and outflow boundaries from
initial convection.  VWP shows 25-35kts of 925-850mb flow within
the q-axis with 1.75-2" total PWATs stretched out across central
IND back to the 850mb inflection in SE MO.  This advection/q-axis
has some remaining uncapped/weakly capped 1000-1500 J/kg of MLCAPE
that can be utilized at those random intersections of deep layer
moisture convergence near the boundaries.  Additionally, 300-500mb
flow is increasingly diffluent along th southeast side of the
clustering providing solid ascent/outflow to maintain favorable
ascent through the overnight period.

As such, recent 10.3um EIR and RADAR mosaic shows increasing
convective activity mainly along the upwind flanking line of the
stronger outflow boundary from the original MCV across central IND
back into S IL, as well as the best convergence in SE MO into S
IL.  Overall, moisture flux and vigor suggests increasing rainfall
efficiency toward 1.5-2"/hr likely to evolve over the next few
hours, particularly in the best unstable environment from MO to SW
IND.  Each cluster has solid potential for 1-2.5" totals...but
deep layer steering between waves is flattening to support
clusters repeating through the overnight period and may result in
localized pockets up to 3.5" though most streaks/clusters of
enhanced totals will be in the 2-3" range.

Hydrologically, grounds are fairly average in soil moisture and
therefor should up-take modest rainfall well with good
infiltration.  However, the rates near 2" are in the vicinity of
the hourly FFG values, as well as the 3hr values ranging from
2-3".  This provides enough confidence for a few scattered
incidents of possible flash flooding over the next 6hrs and
matches up well with 00z HREF probability of 3"/6hr probability
ranging up to 45% across potions of the highlighted area of
concern.

Gallina

ATTN...WFO...ILX...IND...LMK...LSX...PAH...

ATTN...RFC...MSR...ORN...TIR...NWC...

LAT...LON   39928640 39478601 38658610 38038669 37408752
            37188787 36988828 36708882 36699006 36589049
            36739102 37089099 37549037 38268901 38568846
            39158772 39858698
Download in GIS format: Shapefile
| KML
Last Updated: 1259 AM EDT Thu Jun 05 2025
|


