| WPC Met Watch |
|
|
Mesoscale Precipitation Discussion: #0864 (2018) |
|
(Issued at 437 AM EDT Wed Sep 19 2018
) |
|
| MPD Selection |
|
|
|
|
|

Mesoscale Precipitation Discussion 0864
NWS Weather Prediction Center College Park MD
437 AM EDT Wed Sep 19 2018

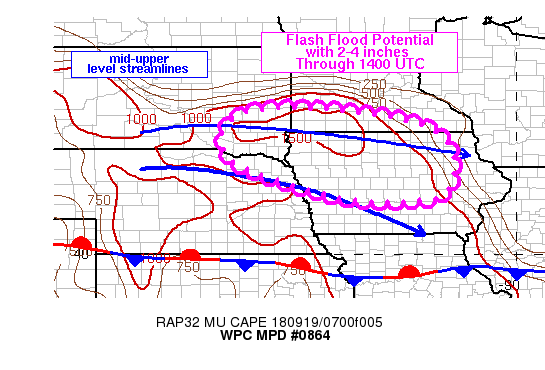
Areas affected...Mid-Missouri Valley into Iowa/southern MN

Concerning...Heavy rainfall...Flash flooding likely

Valid 190835Z - 191435Z

Summary...Convective coverage should continue to increase through
12Z across portions of the Mid-Missouri Valley into IA and far
southwestern MN. 2-4 inches will be possible where training sets
up the longest through 14-15Z.

Discussion...Loops of regional radar imagery through 08Z showed
increasing thunderstorm coverage and intensity across portions of
the Mid-Missouri valley. The increase appears to be driven largely
by increased instability with the SPC mesoanalysis page showing a
600+ J/kg increase in MUCAPE ending 07Z from the eastern SD/NE
border into northwestern IA driven by increased low level moisture
transport. At 08Z, the strongest of these cells was over
southeastern SD over Charles Mix and Bon Homme counties with KFSD
dual-pol rainfall estimates of 1-2 in/hr. These cells were
elevated in nature, well north of a surface front draped west to
east across northern KS/MO, and were being forced in part by low
level warm advection via a 25-35 kt 850 mb jet across eastern NE
(as seen from area VAD wind data). Vertical motions may be
enhanced by flow aloft which was slightly diffluent given the
presence of a mid-upper level ridge centered over OK.

Further increases in MUCAPE are forecast by the RAP with 1000+
J/kg expected to be widespread across the Mid-Missouri Valley into
much of central/western IA by 12Z. Although cell motions have
varied quite a bit up until this point, average movement has been
off toward the east between 15-25 kt, roughly parallel to the
925-850 mb boundary that the storms appear to be moving along. As
cell coverage increases with increasing CAPE from southeastern SD
into IA and southern MN, training cores of heavy rain with 1-2
in/hr rain rates will be possible with 6 hour totals peaking in
the 2-4 inch range. These values may cause flash flooding in a few
locations especially with overlap of lower FFG values in northern
IA and along the northern NE/IA border.

Otto

ATTN...WFO...ARX...DMX...DVN...FSD...MPX...OAX...

ATTN...RFC...MBRFC...NCRFC...

LAT...LON   44179597 44029437 43699271 43169193 42389178
            41759204 41559276 41559456 41949622 42399755
            42829827 43579838 44079759
Last Updated: 437 AM EDT Wed Sep 19 2018
|


