|
|
12. Southern Tropical South America
Bolivia / Peru / Northern Paraguay / Western and Central Brazil
Graphics use 1° GFS Model Output
|
|
ALGORITHM
|
GFS 00Z
|
GFS 12Z
|
Identification of Surface Fronts -
FRONT.CMD
Highlights the positions surface fronts based on horizontal
gradients of thickness and dewpoint in the lower troposphere,
and precipitable water to a lesser extent. If present, surface fronts are usually
positioned in the warm edge of the gradient (thick black contours).
|
|
|
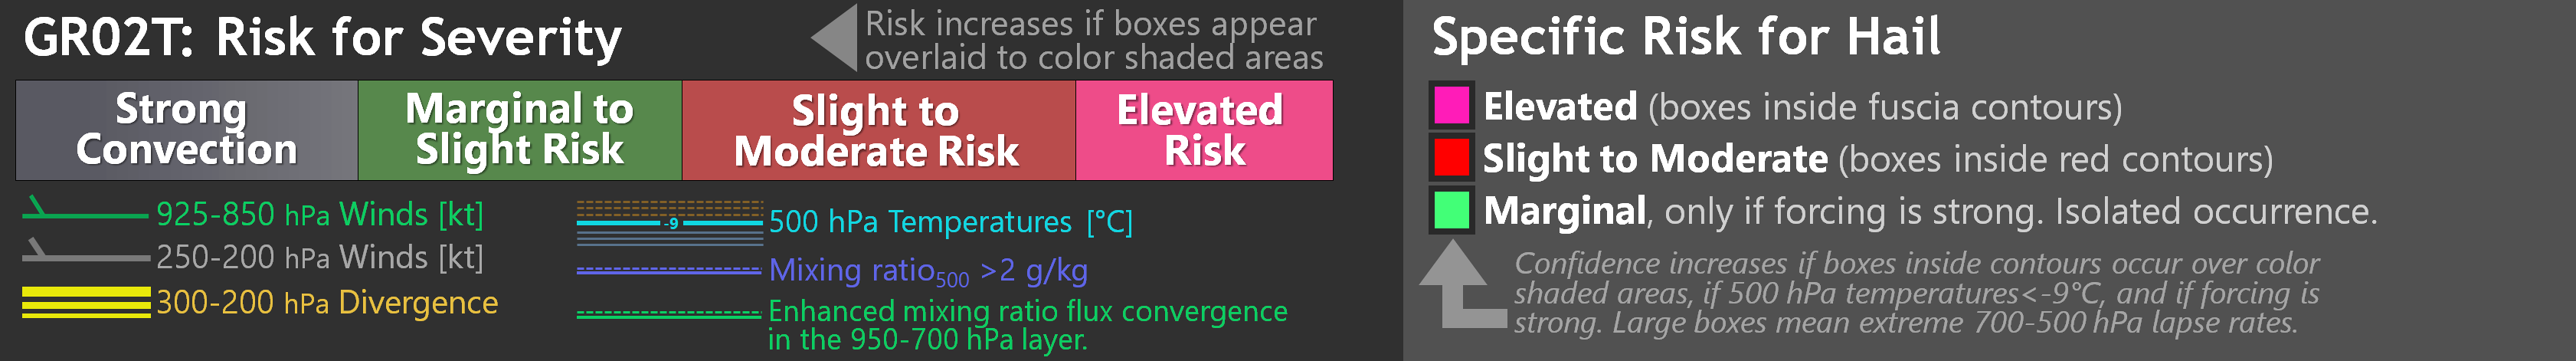
Potential for severity and hail -
GR02T.CMD
GR02T highlights regions with the potential for severe weather
using shades of color, and specifically, detects a potential for hail
where colored boxes appear inside colored contours.
|
|
|
Enhanced GDI and Flow -
EGDI.CMD
Very similar to the GDI, the Enhanced GDI (EGDI) diagnoses the
potential for convection and rainfall accumulations. Loops include low- and
upper-tropospheric flow and other variables to evaluate if atmospheric
dynamics are favorable for triggering and/or sustaining convection.
|
Idle
(Central South America)
|
|
Idle
(Central South America)
|
|
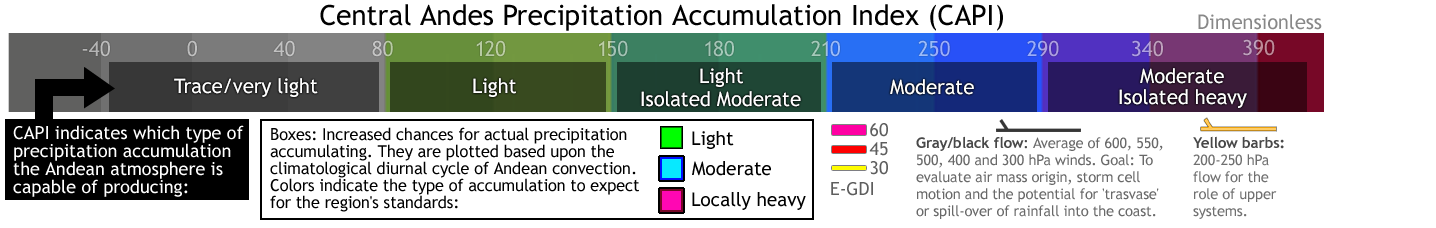
Central Andes Precipitation Accumulation Index -
CAPI.CMD
Tool to evaluate the potential for types of
precipitation amounts
in the central Andes.
CAPI is computed using
700-400 hPa mixing ratios (for column moisture content),
600-400 hPa relative humidity and its advection (for dry air entrainment),
700-500 hPa mixing ratio flux convergence and
300-200 hPa divergence (trigger and dynamically-driven ascent),
500-250 hPa shear (preservation of storm structure),
and the Lifted Index (deep-layer instability).
Boxes appear when the chance of precipitation increases,
upon the climatological diurnal cycle of convection. The
expected intensity is reflected in colors: green=light,
light blue=moderate and fuscia=locally heavy amounts.
Also plotted, the enhanced GDI (>30, >45 and >60 in thick yellow, red and fuscia contours).
The flow is the average of 600, 550, 500, 450 and 300 hPa in kt, to evaluate the origin
of the air mass entering the Andes, storm cell motion and potential
for 'trasvase'/spill over of precipitation into the coast.
Implemented on 27-Jan-2020. Last update: 07-Feb-2020.
|
|
|
Note: These algorithms are only forecast tools, not official forecasts.
For information on the algorithms, click on the red text.
|
|
|


