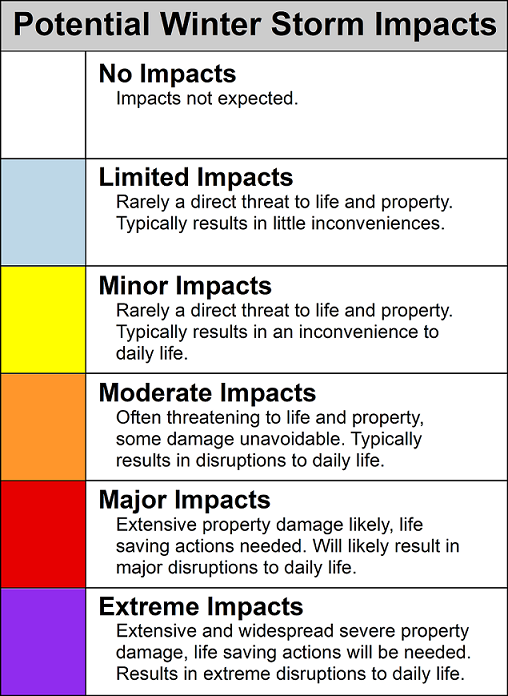
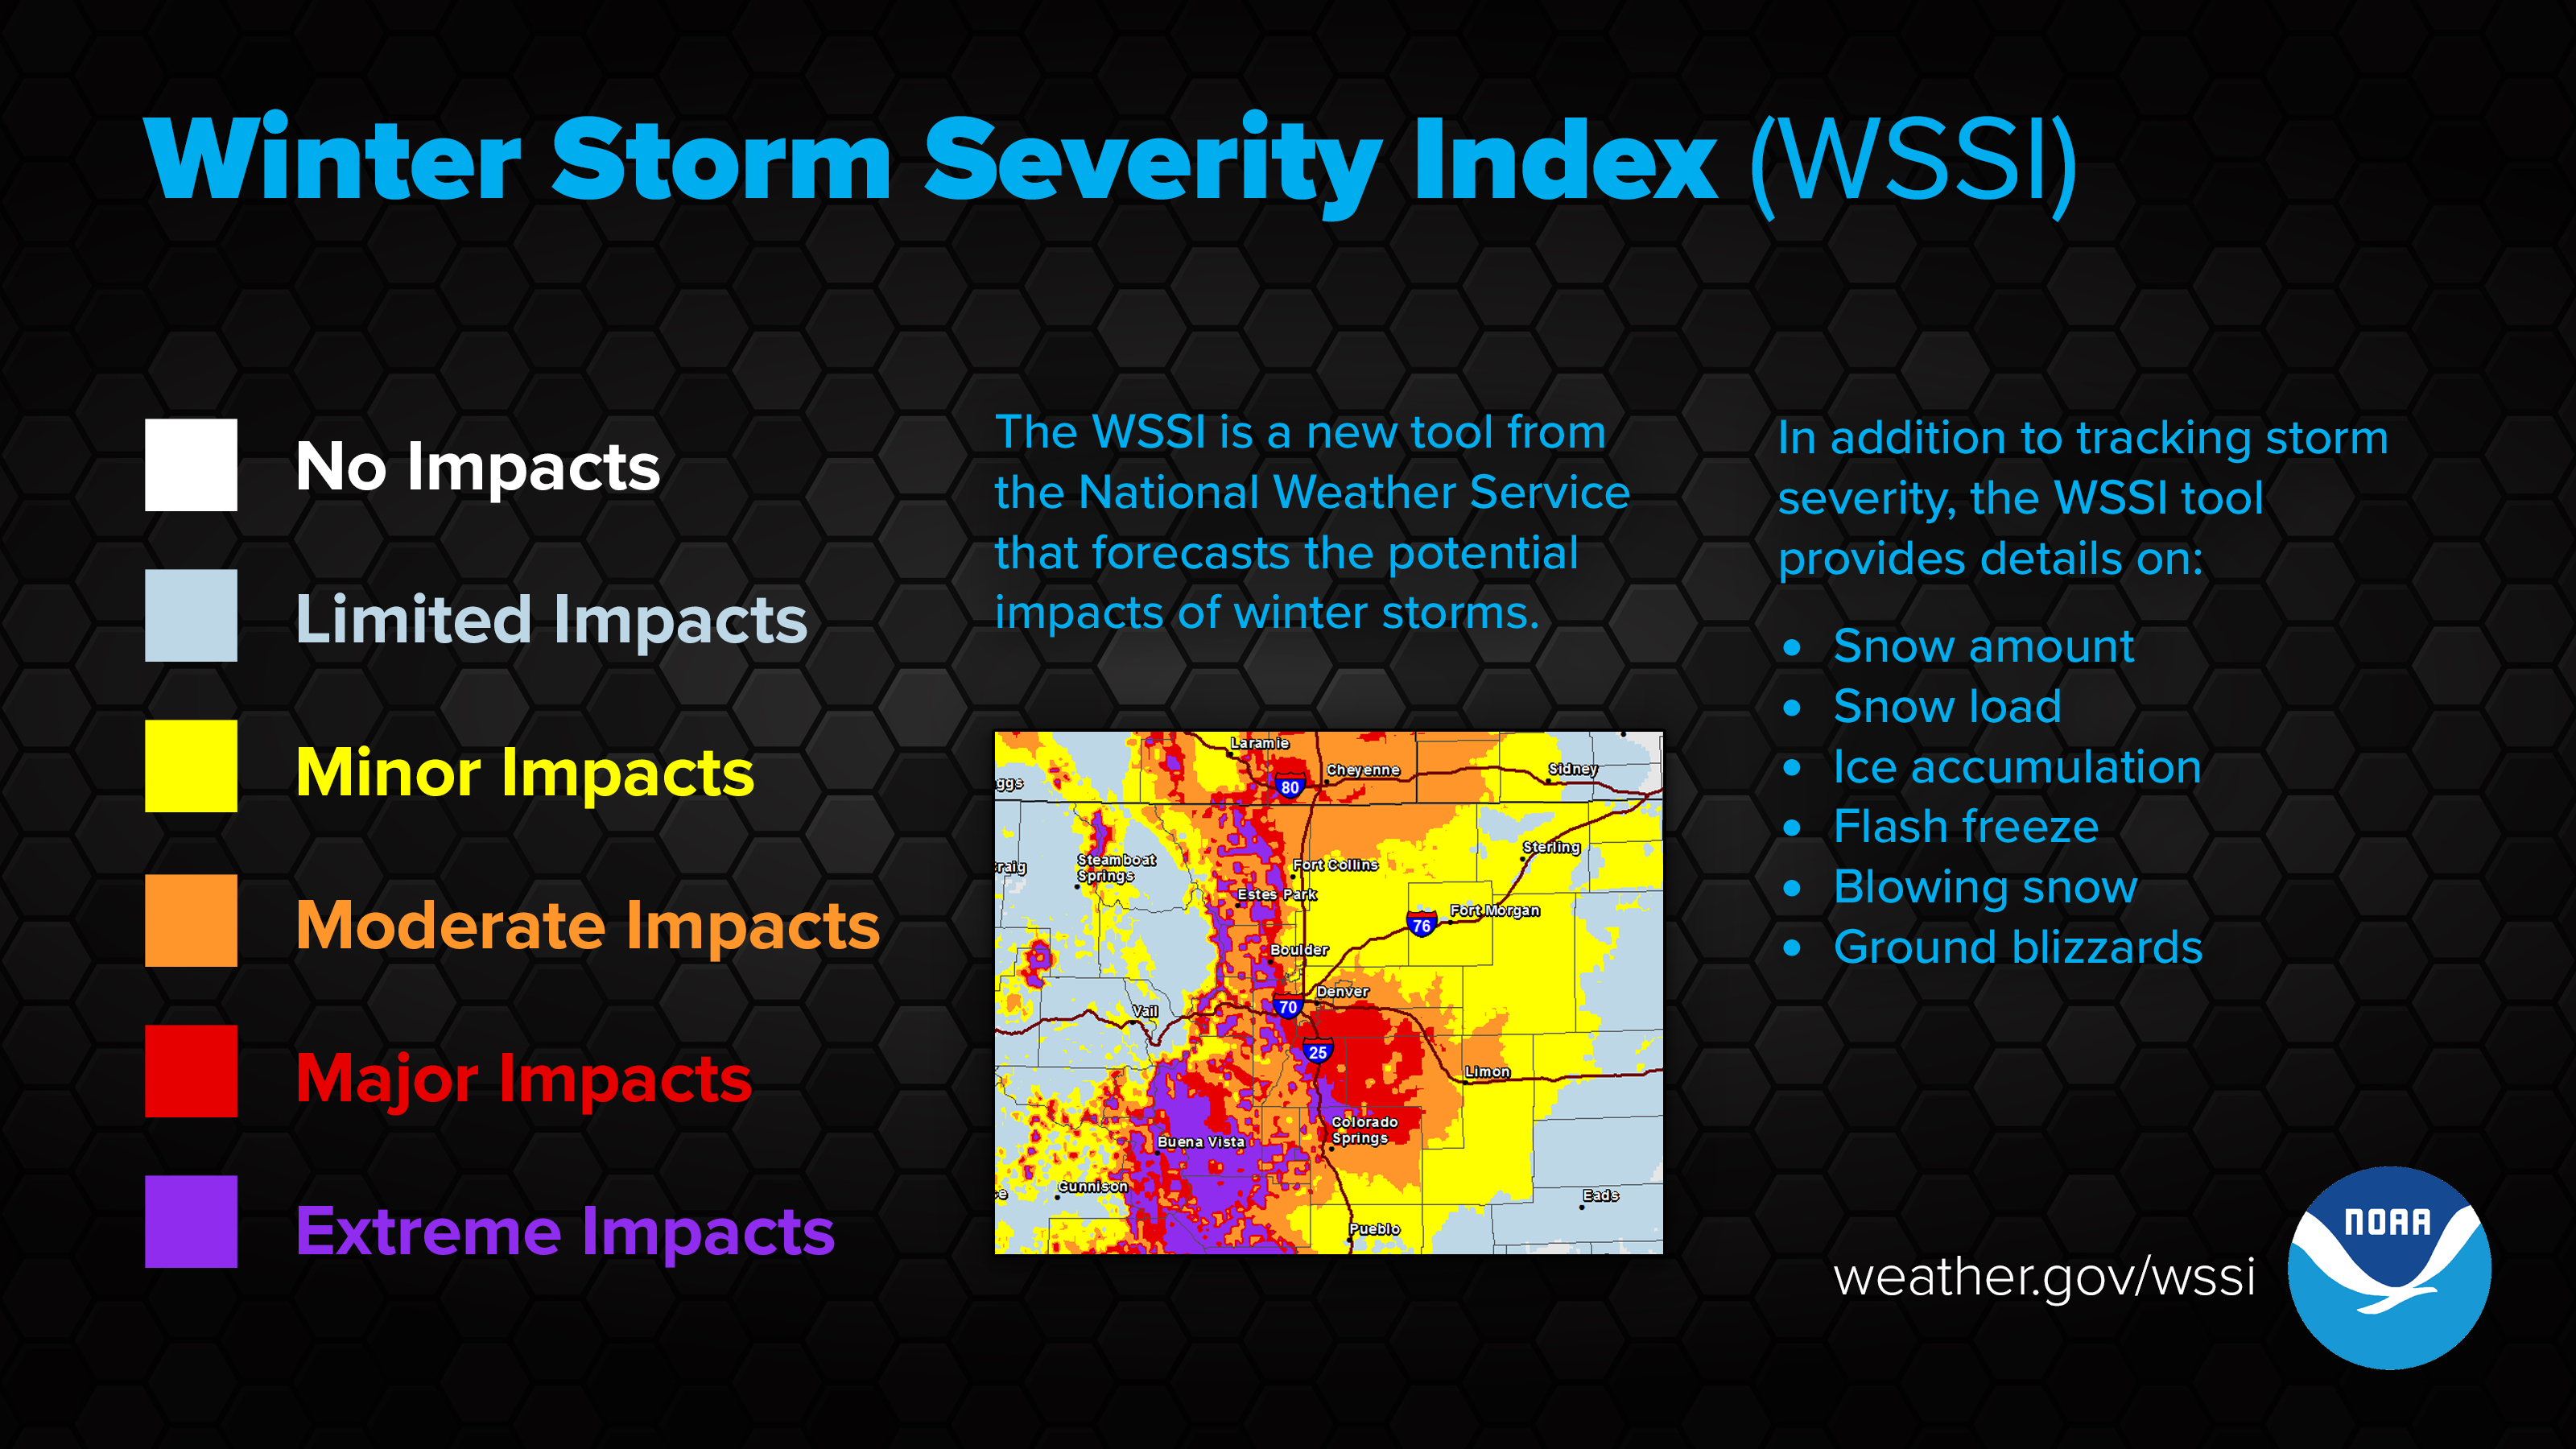
Overall Impact:
Maximum impact from any of the components.
Days 1-3
Day 1
Day 2
Day 3
EXPERIMENTAL
Day 4
Days 1-4
Snow Amount:
Potential impact from snow amount and snow rate.
Days 1-3
Day 1
Day 2
Day 3
EXPERIMENTAL
Day 4
Days 1-4
Snow Load:
Potential impact from the weight of snow on
structures.
Days 1-3
Day 1
Day 2
Day 3
EXPERIMENTAL
Day 4
Days 1-4
Ice Accumulation:
Potential impact from the ice accumulation and
wind.
Days 1-3
Day 1
Day 2
Day 3
Flash Freeze:
Potential impact from rapid decreases in temperature
from
above to below freezing with the presence of liquid water.
Blowing Snow:
Potential impact from falling snow combined with
wind.
Days 1-3
Day 1
Day 2
Day 3
EXPERIMENTAL
Day 4
Days 1-4
Ground Blizzard:
Potential impact from snow on the ground
combined
with wind.
Retrieve Static Images
Select Zoom Area
CONUS
ABQ
ABR
AKQ
ALY
AMA
APX
ARX
BGM
BIS
BMX
BOI
BOU
BOX
BRO
BTV
BUF
BYZ
CAE
CAR
CHS
CLE
CRP
CTP
CYS
DDC
DLH
DMX
DTX
DVN
EAX
EKA
EPZ
EYW
EWX
FFC
FGF
FGZ
FSD
FWD
GGW
GID
GJT
GLD
GRB
GRR
GSP
GYX
HGX
HNX
HUN
ICT
ILM
ILN
ILX
IND
IWX
JAN
JAX
JKL
LBF
LCH
LIX
LKN
LMK
LOT
LOX
LSX
LUB
LWX
LZK
MAF
MEG
MFL
MFR
MHX
MKX
MLB
MOB
MPX
MQT
MRX
MSO
MTR
OAX
OHX
OKX
OTX
OUN
PAH
PBZ
PDT
PHI
PIH
PQR
PSR
PUB
RAH
REV
RIW
RLX
RNK
SEW
SGF
SGX
SHV
SJT
SLC
STO
TAE
TBW
TFX
TOP
TSA
TWC
UNR
VEF
NY
MI
NE
IL
SD
To retrieve static images please select a zoom area and WSSI element.
*Please Note* Static images only update at 01, 09, 13, 19 and 21 UTC


