|
Algorithm
|
GFS 00Z
|
GFS 12Z
|
Enhanced GDI and flow -
EGDI.CMD
The Enhanced Galvez-Davison Index (EGDI) is very similar to the GDI, and
diagnoses the potential for convection and rainfall amounts. These loops
include the low- (1000-850hPa) and upper-tropospheric (400-200hPa)
flow and upper divergence (400-200hPa), to evaluate weather systems and regions with dynamics
favorable for ascent. Low-level (1000-700hPa) moisture flux divergence/convergence
diagnoses surface triggers in moist environments.
|
|
|
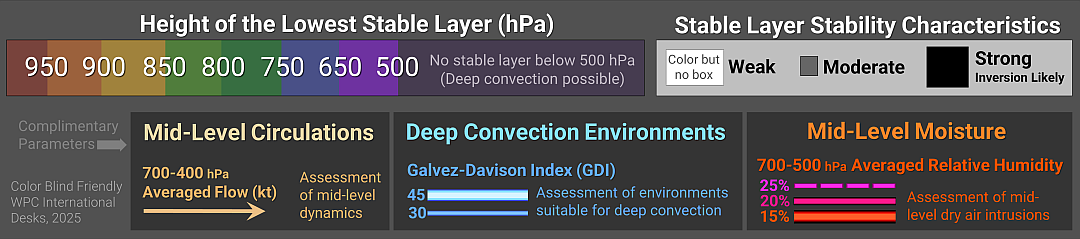
Trade Wind Inversion -
TWIN.CMD
TWIN diagnoses the height of the lowest-lying stable layer
using shaded colors and the strength of the stable layer using boxes.
Complimentary parameters added include the mid-level flow
(700-400 hPa averaged winds), environments favorable for
deep convection (high GDI contours) and dry air
intrusions in the mid-troposphere (700-500 hPa low relative
humidity contours). More information in the
TWIN Algorithm Legend
.
|
|
|
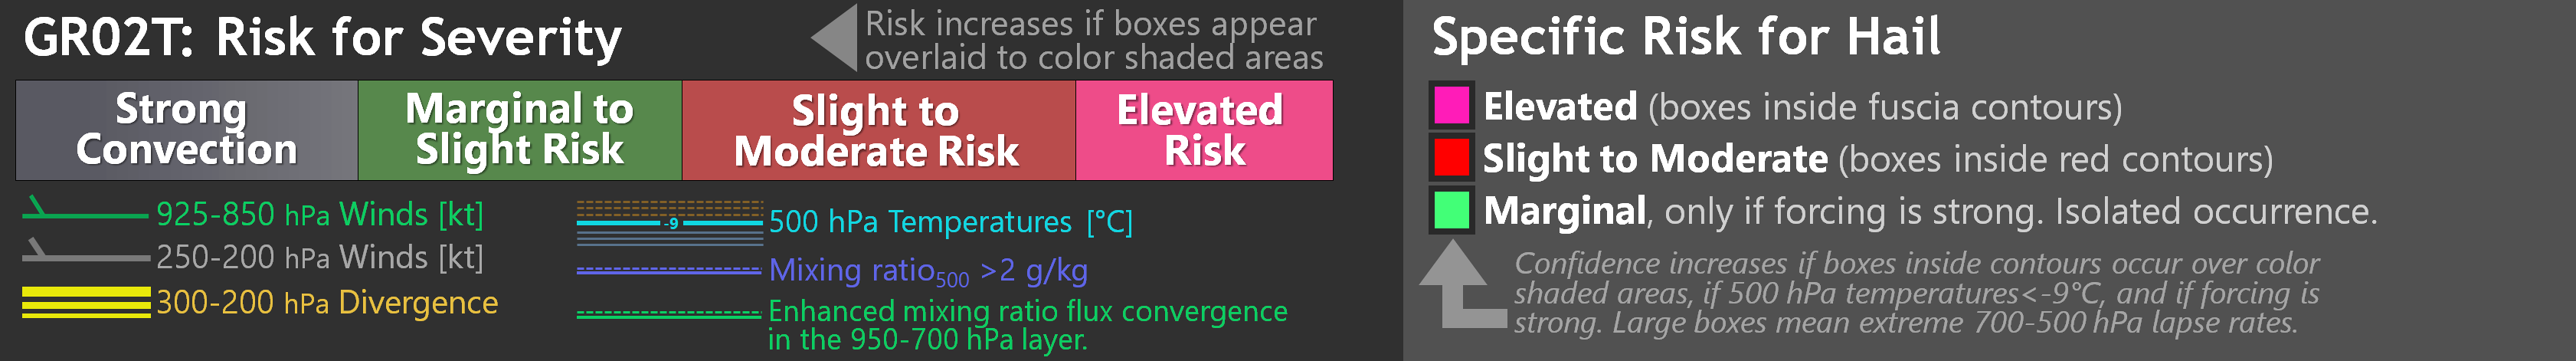
Potential for severity and hail -
GR02T.CMD
GR02T highlights regions with the potential for severe weather
using shades of color, and specifically, detects a potential for hail
where colored boxes appear inside colored contours over a color shaded area.
Includes 500 hPa temperatures as
values < -8°C tend to favor hail when the algorithms shows the potential. Also
includes upper jets and 925-850 hPa low-level flow to find low-level jets.
|
|
|
Identification of Surface Fronts -
FRONT.CMD
FRONT helps to identify surface fronts in subtropical and extra tropical locations.
Highlights the positions surface fronts based on horizontal gradients of thickness
and dewpoint in the lower troposphere, and precipitable water to a lesser extent.
If present, surface fronts are usually positioned in the warm edge of the gradient
(thick black contours).
|
|
|
Tropical Wave Tracking
TROPWW.CMD
Experimental
algorithm to track tropical waves. Western Domain: Caribbean and Central America.
Click
here
for a 1-pager description of the algorithm.
|
|
|
Tropical Wave Tracking
TROPWE.CMD
Experimental
algorithm to track tropical waves. Eastern Domain: Tropical Atlantic/Northeast South America.
Click
here
for a 1-pager description of the algorithm.
|
|
|


