


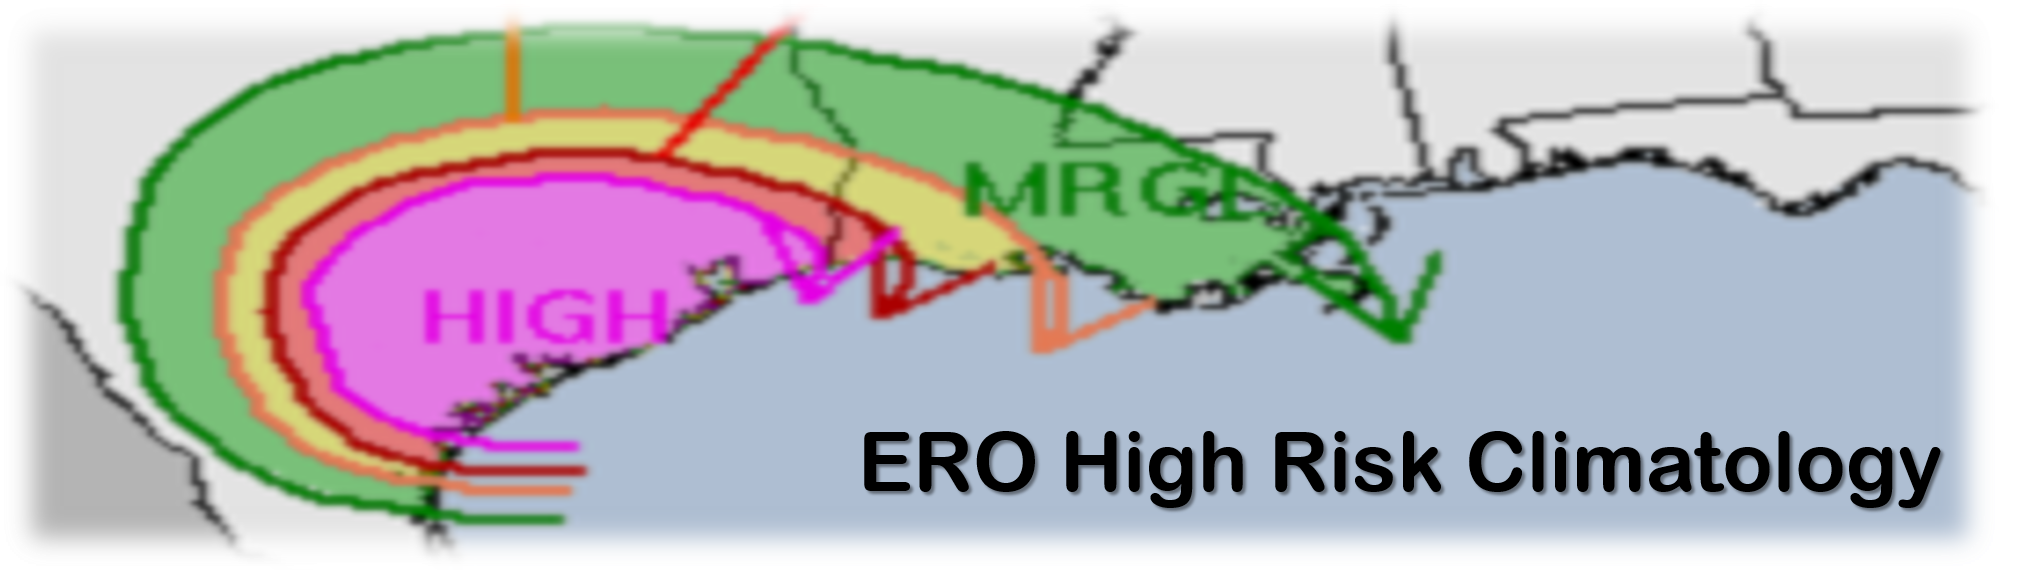
ERO High Risks can foreshadow extreme flash-flood impacts...
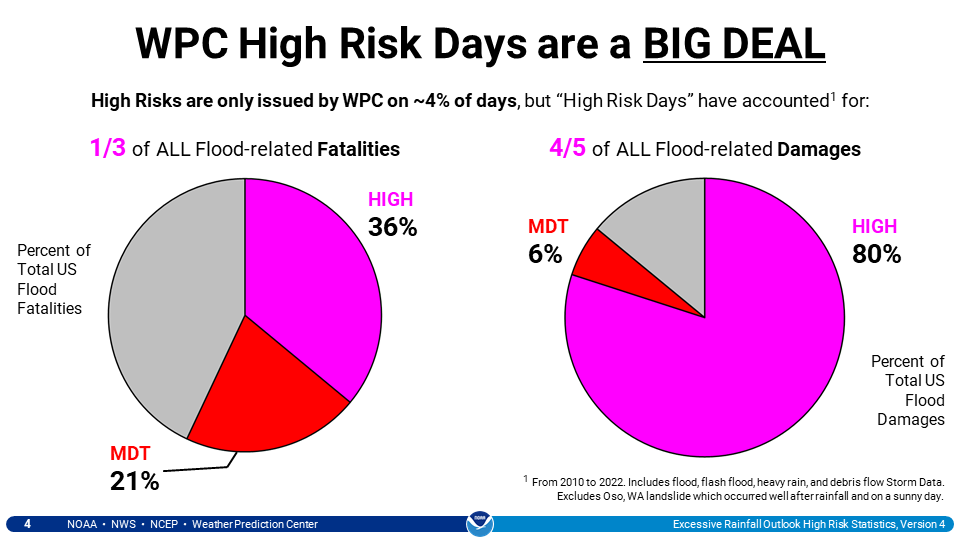
Excessive Rainfall Outlook "High Risk Days" (defined here) indicate potential for extreme impacts from flash flooding. These days correspond to about two out of every five flood-related fatalities and a significant majority of all flood-related property losses in the contiguous United States (CONUS). High Risk Days typically occur with slow-moving tropical systems, atmospheric rivers, or substantial mid-latitude storm systems. This page provides historical context to ERO High Risk areas and insights on ERO trends over the past 5-10 years. Statistics (including dates and tallies) for High Risk Days affecting NWS County Warning Areas, U.S. States, and U.S. Metropolitan Areas are located below and also provided in downloadable formats. For any questions about this content, visit our feedback page or contact Ashton Robinson Cook or Alex Lamers.
Click image to enlarge...
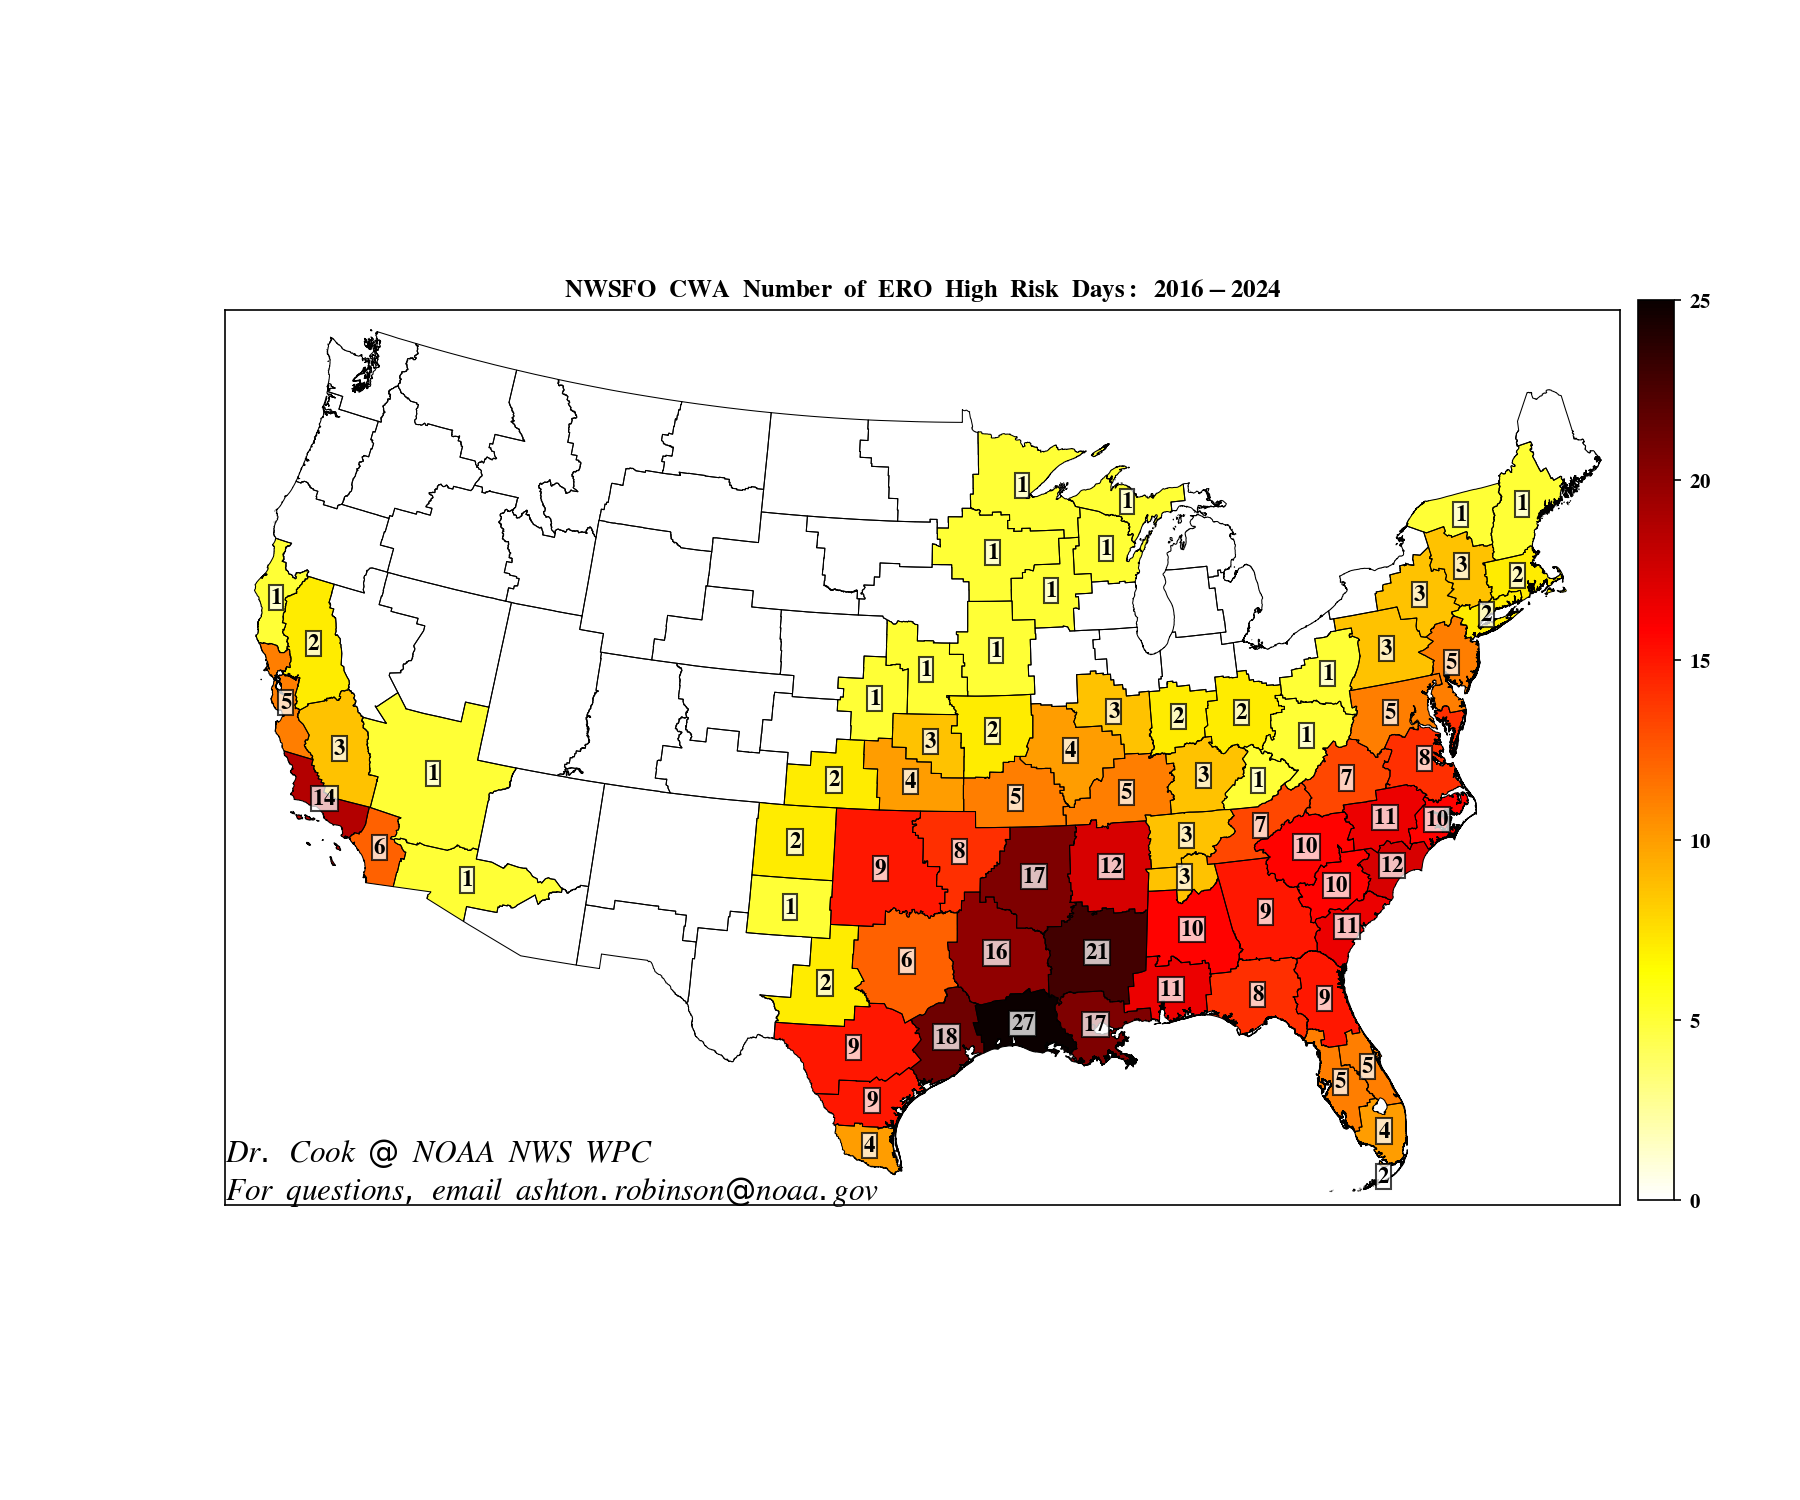
CWAs and High Risk Days: 2016-2024
|
Click image to enlarge... |
For a list of High Risk Days that included all or part of each NWSFO CWA dating back to 2016, click here.
For a list of High Risk Days including all or part of each U.S. state dating back to 2016, click here.
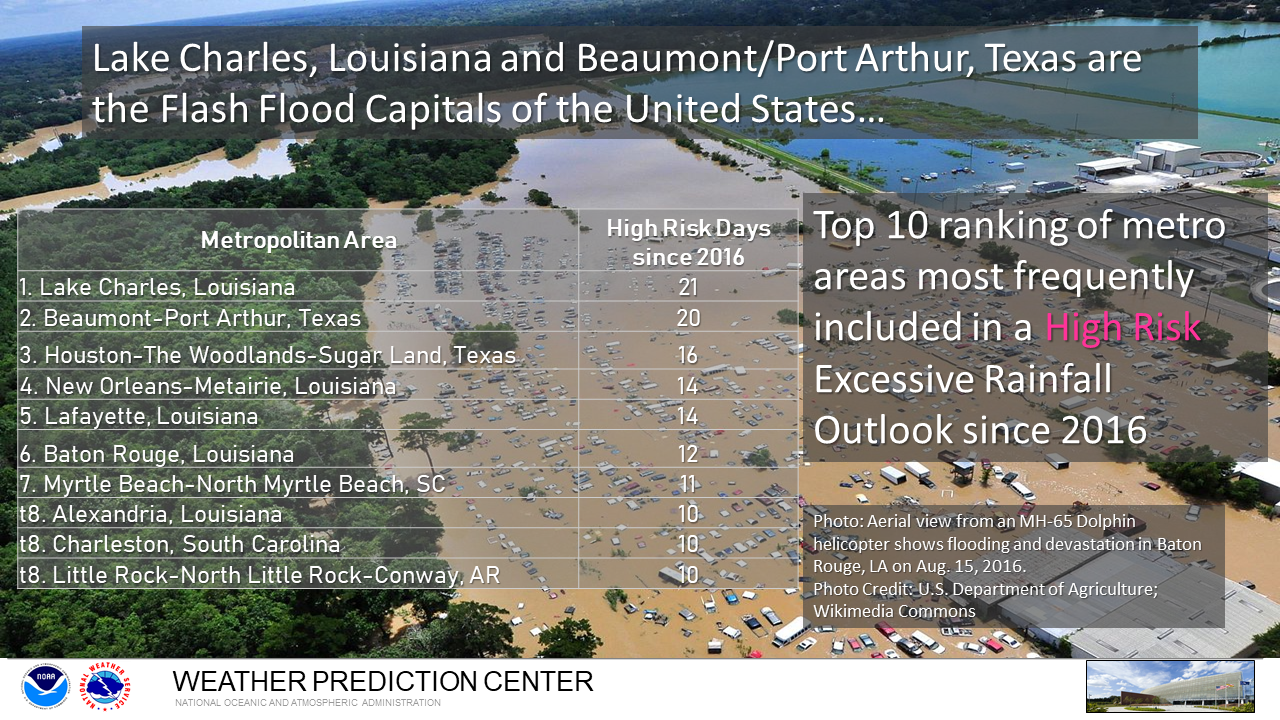
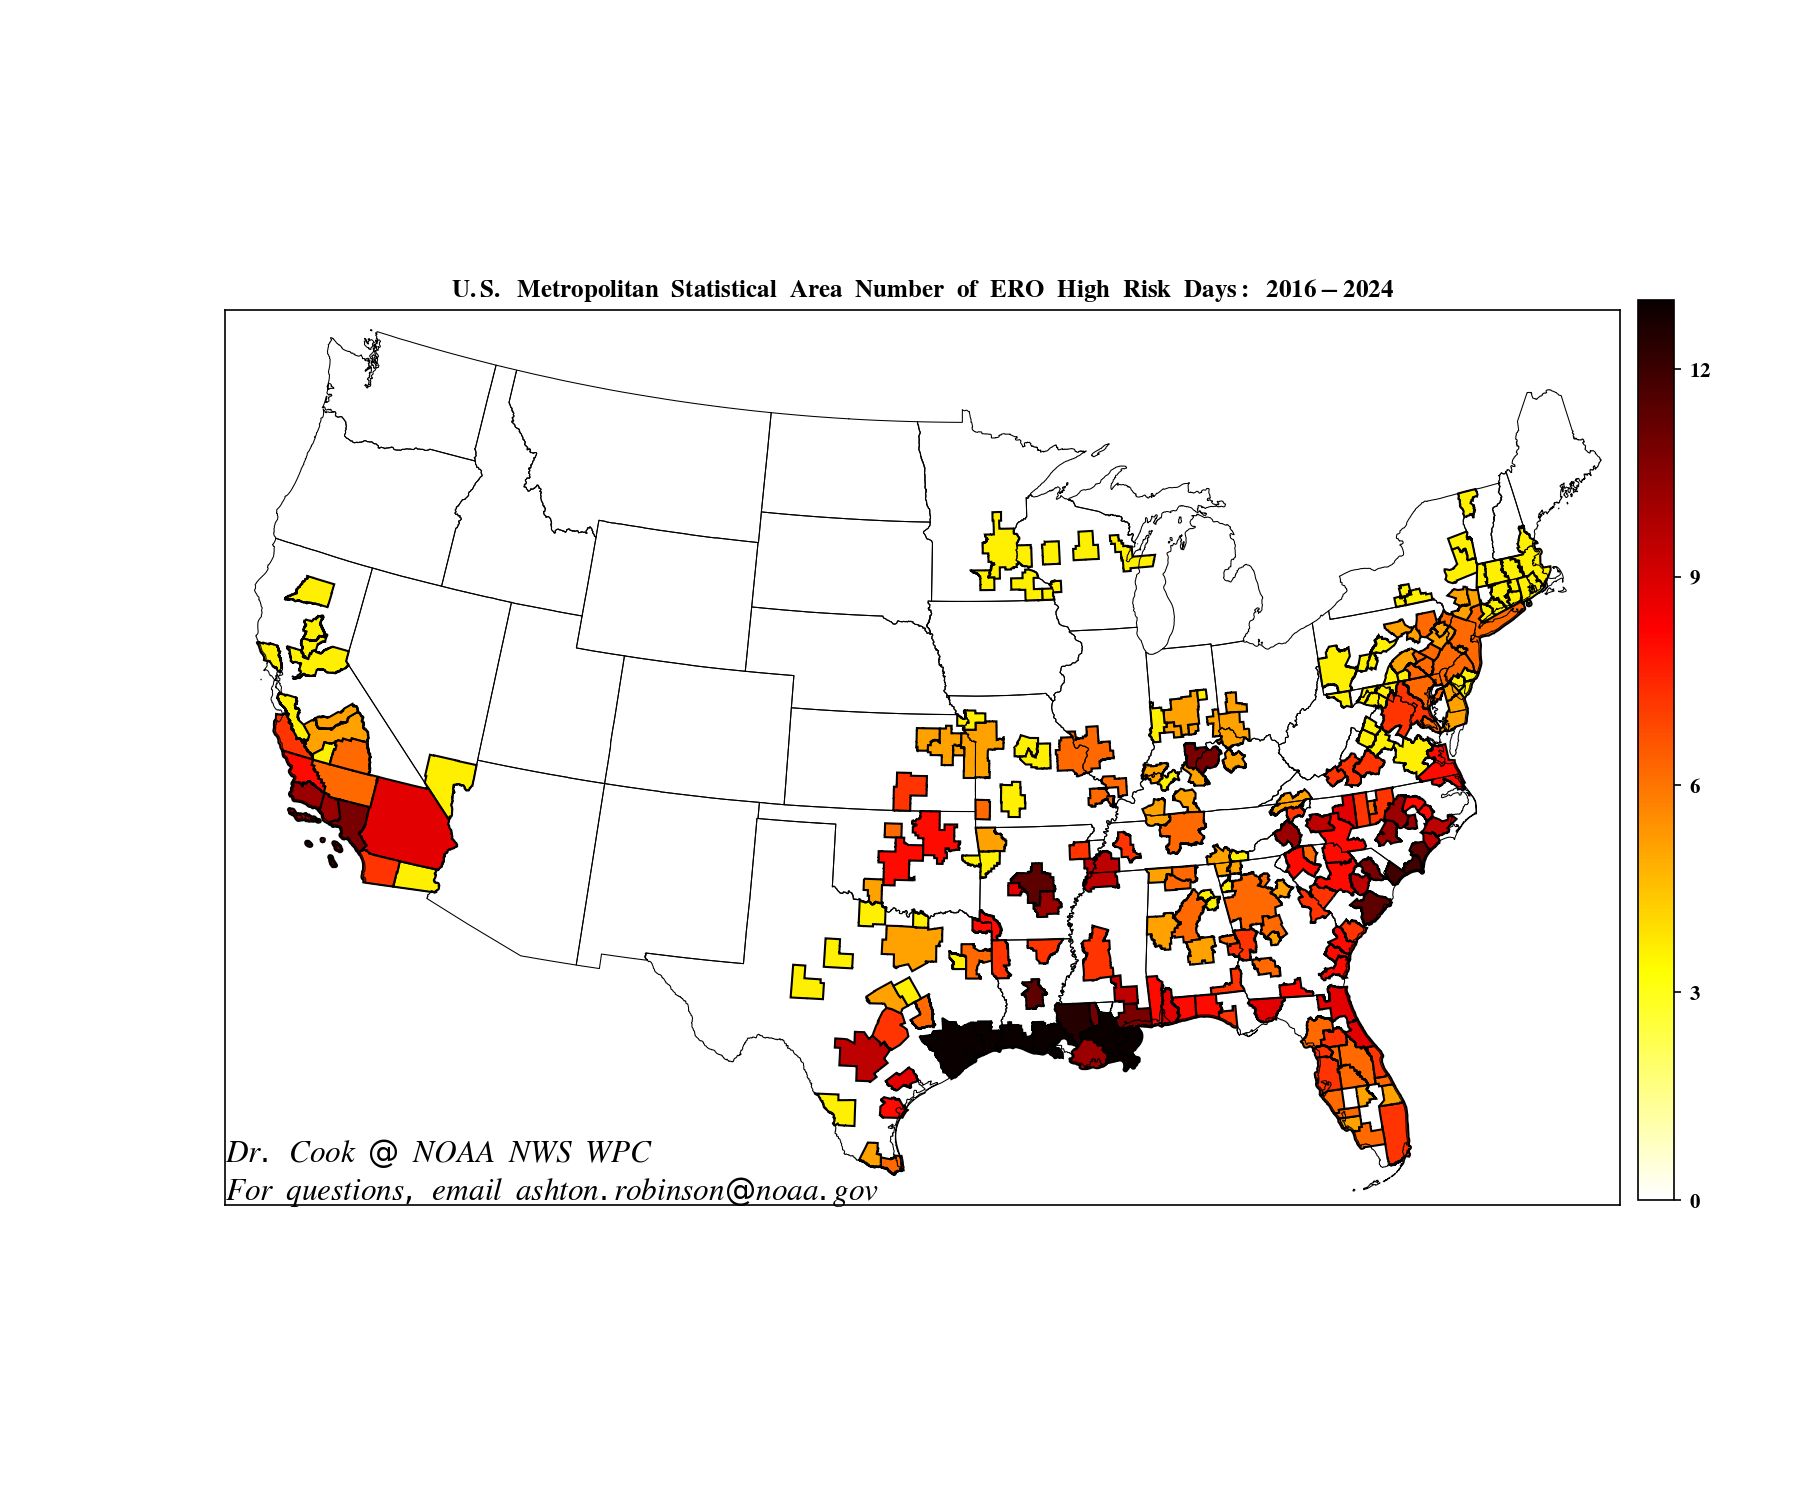
High Risk Hotspots: 2016-2024
Click image to enlarge...
|
Click image to enlarge... |
For a list of High Risk Days that included all or part of each U.S. Metropolitan Statistical Area dating back to 2016, click here.
High Risk Day Casualties and Reported Property Losses: January 2010 - August 2023
Downloadable in the following formats: .csv .tsv (tab-separated) .xlsx
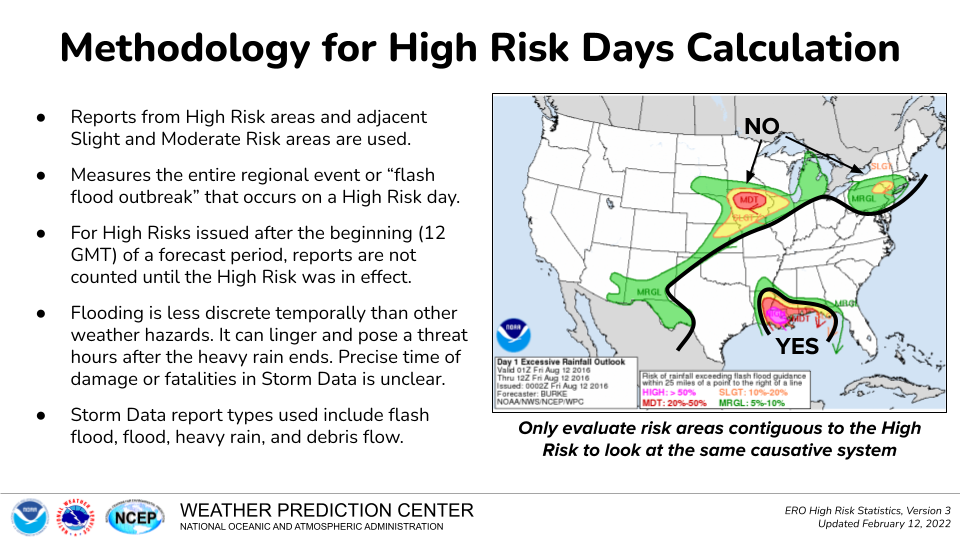
A few notes about ERO product changes over time...
|
|
|
Slight, Moderate, and High Risk Day Trends: 2016-2024
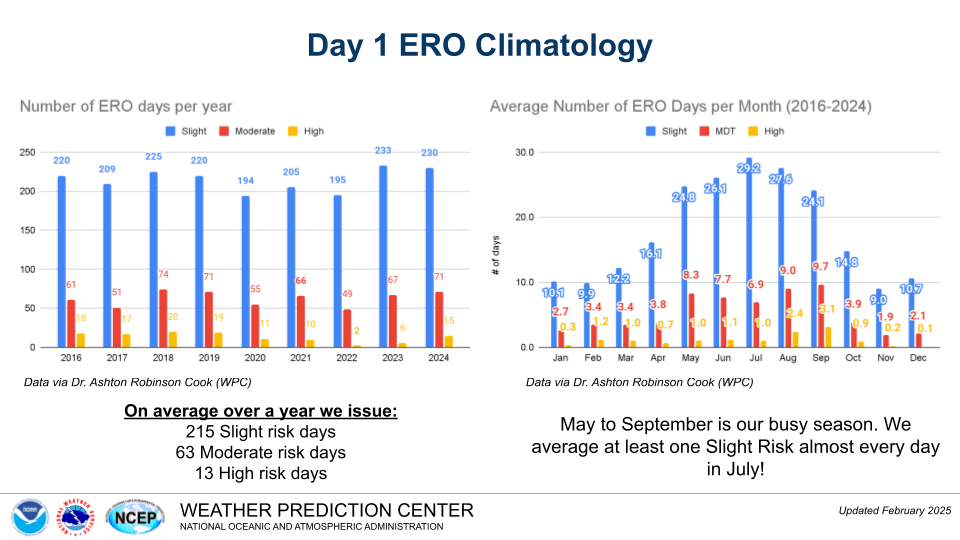
Charts created by Marc Chenard. Underlying dataset created by Ashton Robinson Cook. Click image to enlarge...
Downloads and Helpful Links
For a presentation on High Risk Days since 2010 (in .pdf format), click here.
For some things you can do to prepare on a High Risk Day, click here.
For flash flood preparedness tips, click here.
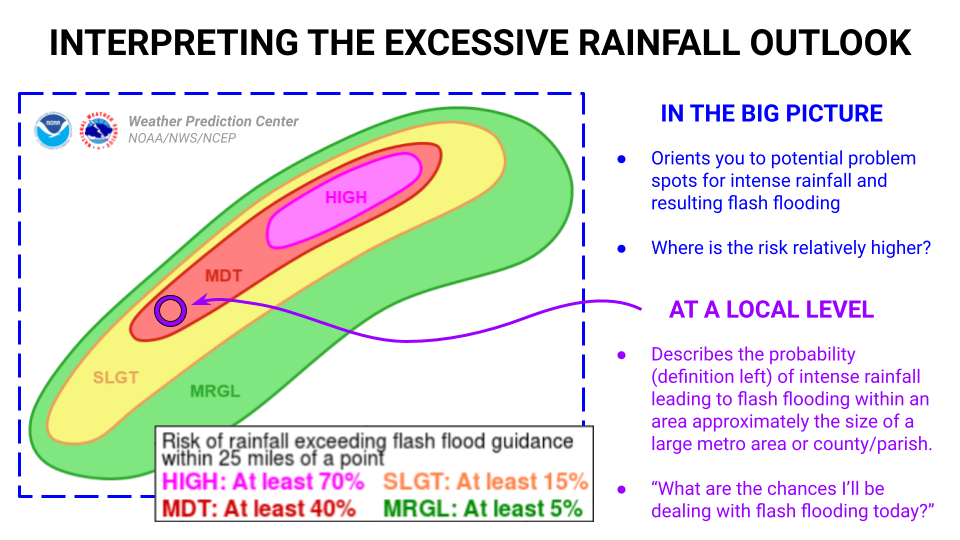
For tips on interpreting the Excessive Rainfall Outlook, click here.
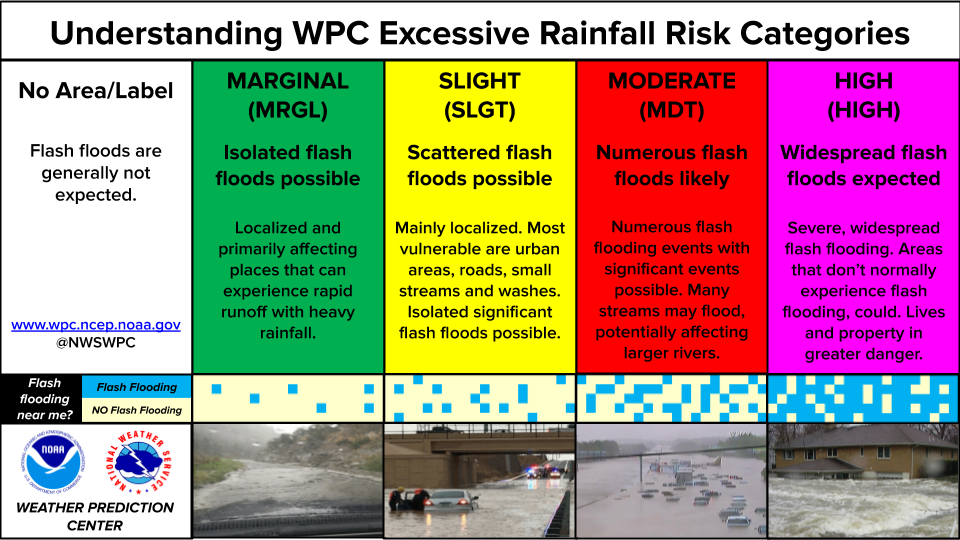
For Excessive Rainfall Outlook categorical descriptions, click here.
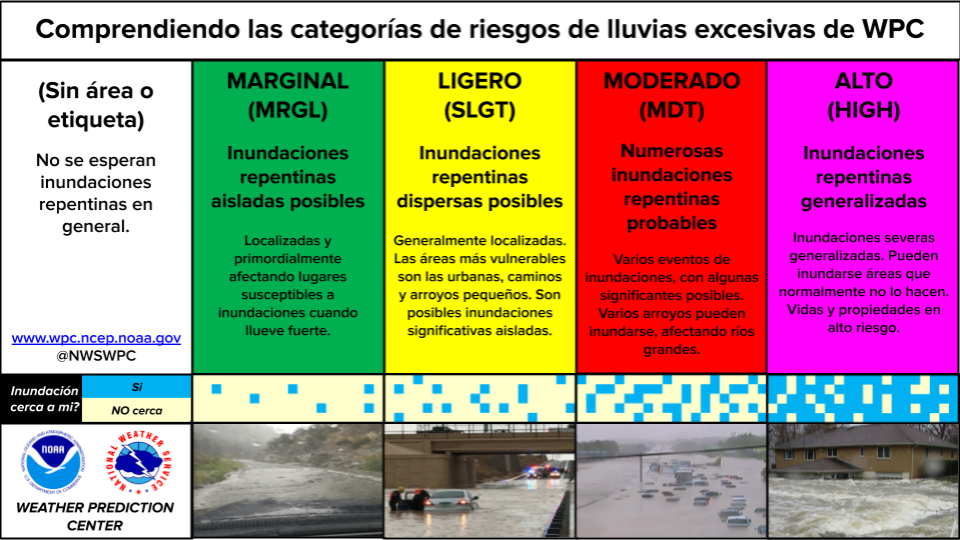
For Excessive Rainfall Outlook categorical descriptions en Español, click here.
For a list of High Risk Days that included all or part of each NWSFO CWA dating back to 2016, click here.
For a list of Moderate Risk Days that included all or part of each NWSFO CWA dating back to 2016, click here.
For a list of Slight Risk Days that included all or part of each NWSFO CWA dating back to 2016, click here.
For a list of High Risk Days including all or part of each U.S. state dating back to 2016, click here.
For a list of Moderate Risk Days including all or part of each U.S. state dating back to 2016, click here.
For a list of Slight Risk Days including all or part of each U.S. state dating back to 2016, click here.
For a list of High Risk Days that included all or part of each U.S. Metropolitan Statistical Area dating back to 2016, click here.
For a list of Moderate Risk Days that included all or part of each U.S. Metropolitan Statistical Area dating back to 2016, click here.
For a list of Slight Risk Days that included all or part of each U.S. Metropolitan Statistical Area dating back to 2016, click here.
NEW:
For a list of High Risk Days that included part of the entire CONUS dating back to 2016, click here.
For a list of Moderate Risk Days that included part of the entire CONUS dating back to 2016, click here.
For a list of Slight Risk Days that included part of the entire CONUS dating back to 2016, click here.
Shapefiles:
Shapefiles are available for download dating back to 2016. For instructions, click here.

