


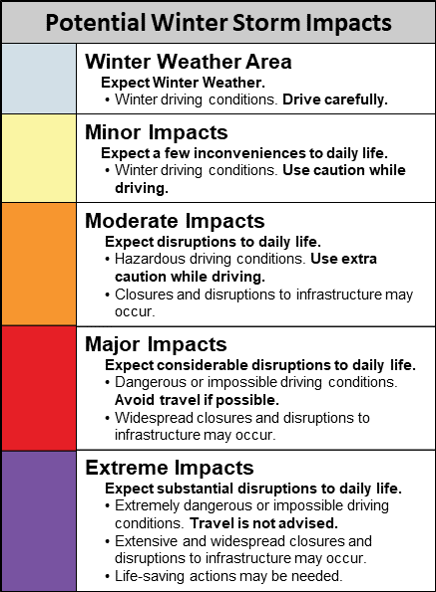
*Prototype Display* Rolling 24 Hour Winter Storm
Severity Index (WSSI)
This display shows the WSSI for a period of 24 hours. Each time-step forward is 6 hours. As you move forward in time using the slider bar you can see how the WSSI is changing every six hours out to the end of the day 3 timeframe.
|
Select WSSI Impact Type: |
Drag the slider to display the 24 hour forecast forecast for impacts.
|
Change image opacity: |
|
|
||||||||||||||||||||
|
|
||||||||||||||||||||||